29
/es/
es
AIzaSyAYiBZKx7MnpbEhh9jyipgxe19OcubqV5w
April 1, 2024
107548
Colombia
COL
true
2
1
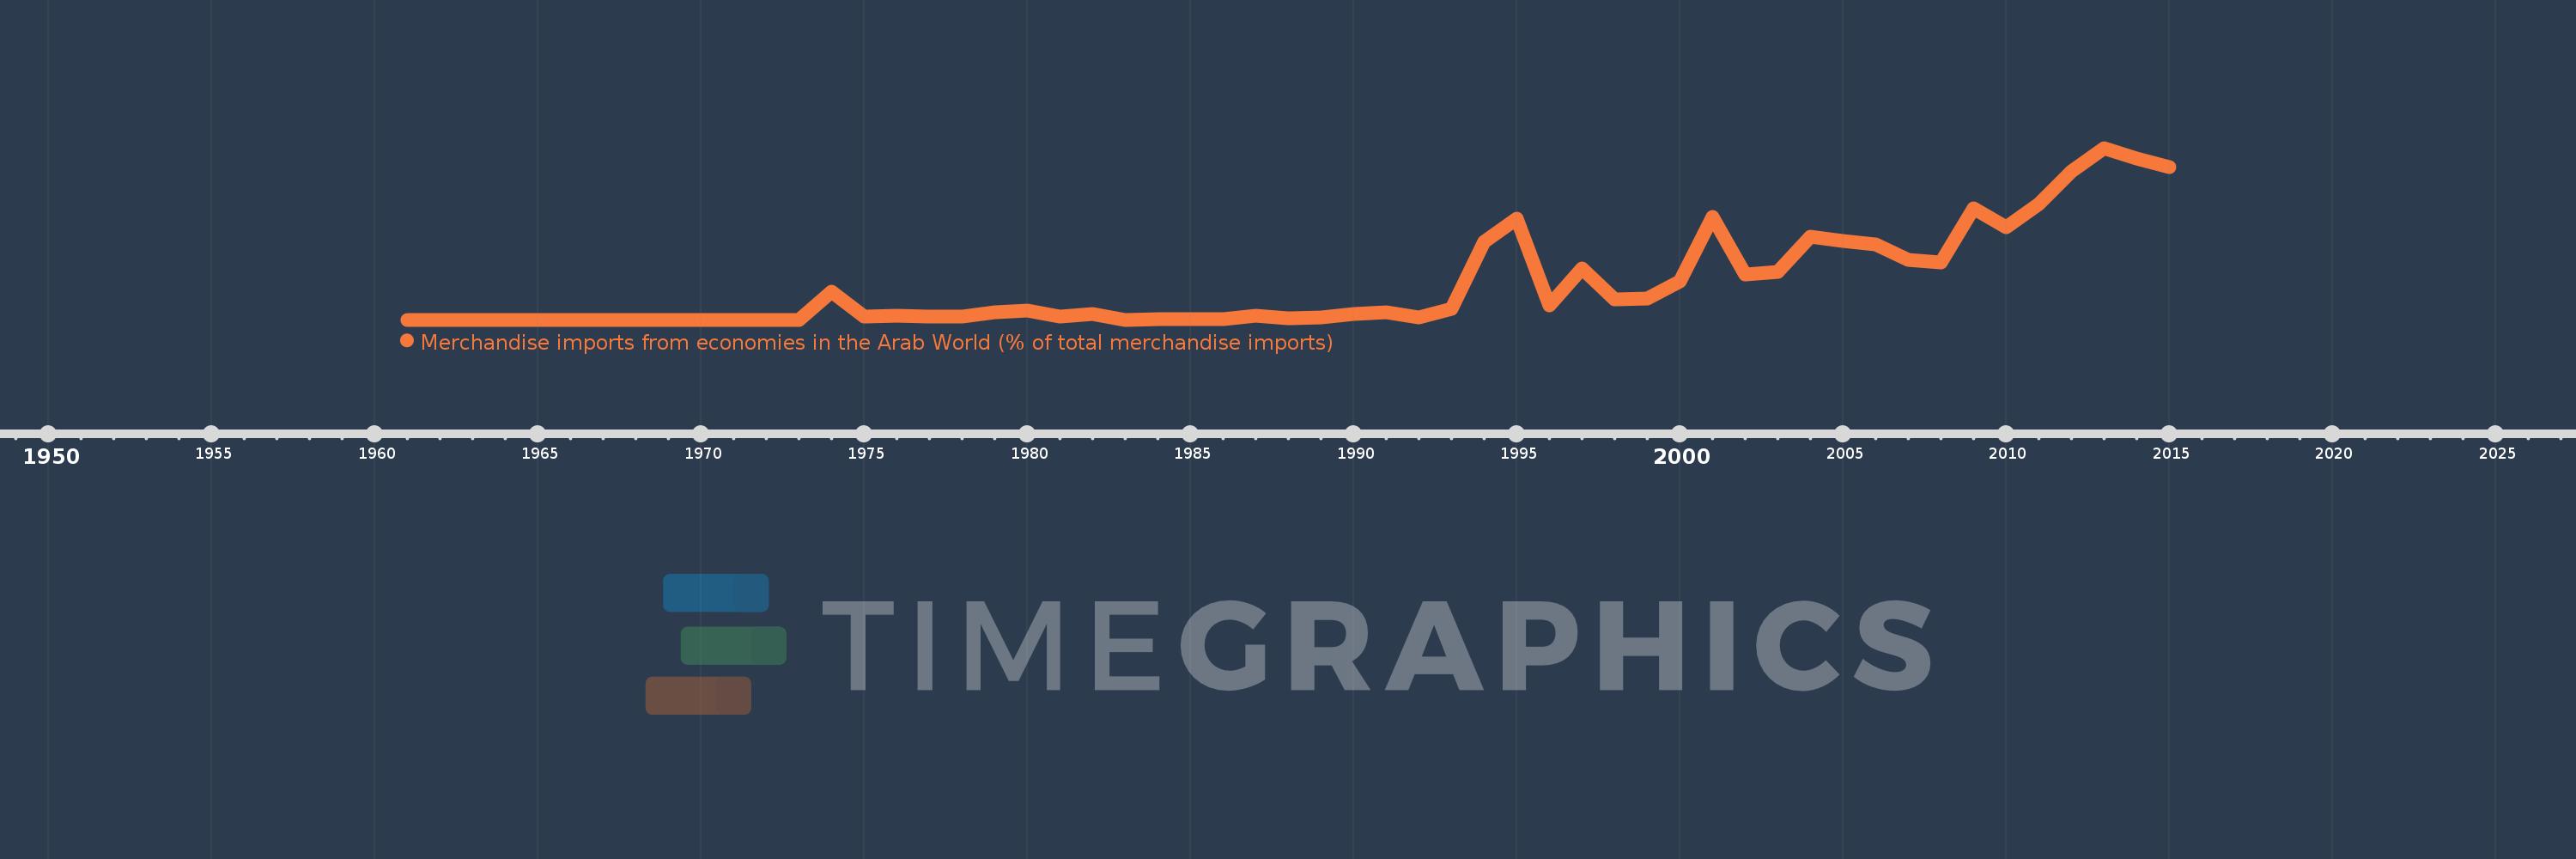
Merchandise imports from economies in the Arab World (% of total merchandise imports)
2015,2014,2013,2012,2011,2010,2009,2008,2007,2006,2005,2004,2003,2002,2001,2000,1999,1998,1997,1996,1995,1994,1993,1992,1991,1990,1989,1988,1987,1986,1985,1984,1983,1982,1981,1980,1979,1978,1977,1976,1975,1974,1973,1972,1971,1970,1969,1968,1967,1966,1965,1964,1963,1962,1961
Estas estadísticas en otros países:
AfghanistanAlbaniaAlgeriaAngolaArab WorldArgentinaArmeniaArubaAustraliaAustriaAzerbaijanBahamas, TheBahrainBangladeshBarbadosBelarusBelgiumBelizeBeninBermudaBoliviaBrazilBrunei DarussalamBulgariaBurkina FasoBurundiCabo VerdeCambodiaCameroonCanadaCaribbean small statesCentral African RepublicCentral Europe and the BalticsChadChileChinaColombiaComorosCongo, Dem. Rep.Congo, Rep.Costa RicaCote d'IvoireCroatiaCubaCyprusCzech RepublicDenmarkDjiboutiDominicaDominican RepublicEarly-demographic dividendEast Asia & PacificEast Asia & Pacific (excluding high income)East Asia & Pacific (IDA & IBRD countries)EcuadorEgypt, Arab Rep.El SalvadorEstoniaEthiopiaEuro areaEurope & Central AsiaEurope & Central Asia (excluding high income)Europe & Central Asia (IDA & IBRD countries)European UnionFijiFinlandFragile and conflict affected situationsFranceFrench PolynesiaGabonGambia, TheGeorgiaGermanyGhanaGreeceGreenlandGrenadaGuatemalaGuineaGuinea-BissauGuyanaHaitiHeavily indebted poor countries (HIPC)High incomeHondurasHong Kong SAR, ChinaHungaryIBRD onlyIcelandIDA & IBRD totalIDA blendIDA onlyIDA totalIndiaIndonesiaIran, Islamic Rep.IraqIrelandItalyJamaicaJapanJordanKazakhstanKenyaKorea, Dem. People’s Rep.Korea, Rep.KuwaitKyrgyz RepublicLao PDRLate-demographic dividendLatin America & Caribbean Latin America & Caribbean (excluding high income)Latin America & the Caribbean (IDA & IBRD countries)LatviaLeast developed countries: UN classificationLebanonLiberiaLibyaLithuaniaLow & middle incomeLow incomeLower middle incomeLuxembourgMacao SAR, ChinaMacedonia, FYRMadagascarMalawiMalaysiaMaldivesMaliMaltaMauritaniaMauritiusMexicoMiddle East & North AfricaMiddle East & North Africa (excluding high income)Middle East & North Africa (IDA & IBRD countries)Middle incomeMoldovaMongoliaMontenegroMoroccoMozambiqueMyanmarNepalNetherlandsNew CaledoniaNew ZealandNicaraguaNigerNigeriaNorth AmericaNorwayOECD membersOmanOther small statesPacific island small statesPakistanPanamaPapua New GuineaParaguayPeruPhilippinesPolandPortugalPost-demographic dividendPre-demographic dividendQatarRomaniaRussian FederationRwandaSaudi ArabiaSenegalSerbiaSeychellesSierra LeoneSingaporeSlovak RepublicSloveniaSmall statesSomaliaSouth AfricaSouth AsiaSouth Asia (IDA & IBRD)SpainSri LankaSt. LuciaSt. Vincent and the GrenadinesSub-Saharan Africa Sub-Saharan Africa (excluding high income)Sub-Saharan Africa (IDA & IBRD countries)SudanSurinameSwedenSwitzerlandSyrian Arab RepublicTajikistanTanzaniaThailandTogoTrinidad and TobagoTunisiaTurkeyTurkmenistanUgandaUkraineUnited Arab EmiratesUnited KingdomUnited StatesUpper middle incomeUruguayVenezuela, RBVietnamWorldYemen, Rep.ZambiaZimbabwe línea de tiempo (timeline):
En esta escala de tiempo se presenta un gráfico de 1961 y 2015 de Colombia. Los datos de 1960 están ausentes. El número de observaciones reales por fecha: 55.
Fuente (nombre):
Indicadores del desarrollo mundial
Fuente (organización):
World Bank staff estimates based data from International Monetary Fund's Direction of Trade database.
Categorías:
Private Sector, Trade
Se ha actualizado:
23 abr 2017 año
Los indicadores de los cambios de valor en los últimos años
Máximo:
0.304
1 ene 2013 año
A la fecha de observación
Valor
Cambio absoluto
El cambio con respecto al valor anterior
1 ene 1961 año
0.0
0.0
0.0%
1 ene 1974 año
0.05
+0.05
%
1 ene 1975 año
0.006
-0.044
-87.45%
1 ene 1976 año
0.007
+0.001
17.54%
1 ene 1977 año
0.005
-0.002
-28.39%
1 ene 1978 año
0.005
0.0
-6.42%
1 ene 1979 año
0.013
+0.008
171.68%
1 ene 1980 año
0.016
+0.002
17.74%
1 ene 1981 año
0.005
-0.01
-66.01%
1 ene 1982 año
0.01
+0.005
93.71%
1 ene 1983 año
0.0
-0.01
-98.24%
1 ene 1984 año
0.001
+0.001
561.55%
1 ene 1985 año
0.001
+0.0
10.59%
1 ene 1986 año
0.001
-0.001
-45.62%
1 ene 1987 año
0.007
+0.006
810.78%
1 ene 1988 año
0.003
-0.004
-53.51%
1 ene 1989 año
0.004
+0.0
15.55%
1 ene 1990 año
0.01
+0.006
173.79%
1 ene 1991 año
0.013
+0.004
38.48%
1 ene 1992 año
0.004
-0.009
-68.99%
1 ene 1993 año
0.019
+0.015
362.78%
1 ene 1994 año
0.138
+0.119
614.27%
1 ene 1995 año
0.179
+0.041
29.53%
1 ene 1996 año
0.025
-0.154
-86.03%
1 ene 1997 año
0.091
+0.066
262.75%
1 ene 1998 año
0.036
-0.054
-59.97%
1 ene 1999 año
0.038
+0.002
4.27%
1 ene 2000 año
0.068
+0.031
80.83%
1 ene 2001 año
0.182
+0.114
166.69%
1 ene 2002 año
0.08
-0.103
-56.28%
1 ene 2003 año
0.085
+0.006
7.11%
1 ene 2004 año
0.147
+0.062
72.1%
1 ene 2005 año
0.139
-0.008
-5.74%
1 ene 2006 año
0.133
-0.005
-3.71%
1 ene 2007 año
0.106
-0.028
-20.78%
1 ene 2008 año
0.102
-0.004
-3.34%
1 ene 2009 año
0.197
+0.095
93.04%
1 ene 2010 año
0.164
-0.033
-16.69%
1 ene 2011 año
0.204
+0.04
24.06%
1 ene 2012 año
0.263
+0.059
28.77%
1 ene 2013 año
0.304
+0.041
15.59%
1 ene 2014 año
0.286
-0.018
-5.86%
1 ene 2015 año
0.27
-0.016
-5.54%
Ranking de los países por los datos estadísticos actuales


Comentarios: