29
/es/
es
AIzaSyAYiBZKx7MnpbEhh9jyipgxe19OcubqV5w
April 1, 2024
77347
Bahrain
BHR
true
2
1
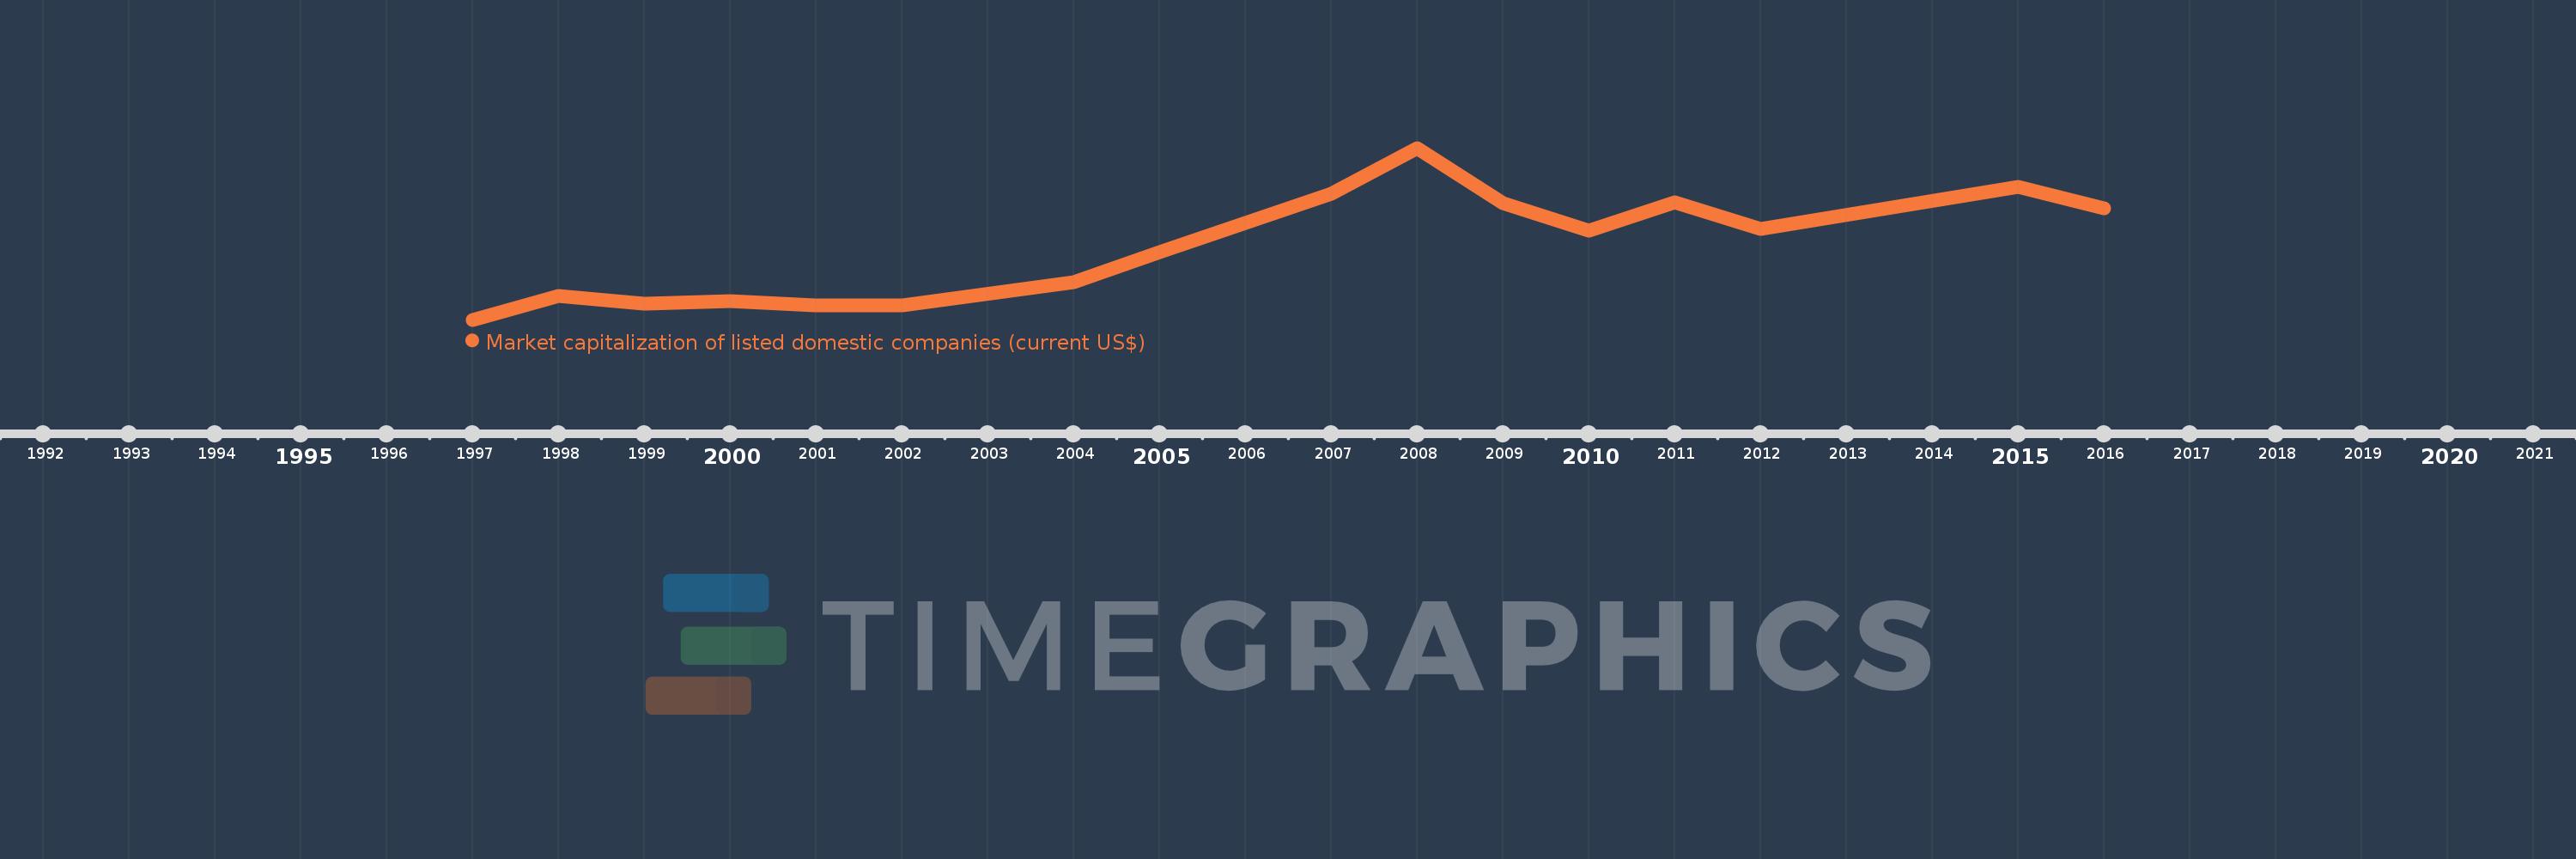
Market capitalization of listed domestic companies (current US$)
2016,2015,2012,2011,2010,2009,2008,2007,2006,2005,2004,2002,2001,2000,1999,1998,1997
Estas estadísticas en otros países:
línea de tiempo (timeline):
En esta escala de tiempo se presenta un gráfico de 1997 y 2016 de Bahrain. Los datos de 1996 están ausentes. El número de observaciones reales por fecha: 17.
Fuente (nombre):
Indicadores del desarrollo mundial
Fuente (organización):
World Federation of Exchanges database.
Categorías:
Financial Sector
Se ha actualizado:
23 abr 2017 año
Los indicadores de los cambios de valor en los últimos años
Mínimo:
4.711 bn
1 ene 1997 año
Máximo:
27.088 bn
1 ene 2008 año
A la fecha de observación
Valor
Cambio absoluto
El cambio con respecto al valor anterior
1 ene 1997 año
4.711 bn
+4.711 bn
0.0%
1 ene 1998 año
7.833 bn
+3.122 bn
66.26%
1 ene 1999 año
6.769 bn
-1.064 bn
-13.58%
1 ene 2000 año
7.159 bn
+389.61 millones
5.76%
1 ene 2001 año
6.624 bn
-534.49 millones
-7.47%
1 ene 2002 año
6.599 bn
-24.85 millones
-0.38%
1 ene 2004 año
9.627 bn
+3.027 bn
45.87%
1 ene 2005 año
13.541 bn
+3.914 bn
40.66%
1 ene 2006 año
17.365 bn
+3.824 bn
28.24%
1 ene 2007 año
21.122 bn
+3.758 bn
21.64%
1 ene 2008 año
27.088 bn
+5.966 bn
28.24%
1 ene 2009 año
19.947 bn
-7.141 bn
-26.36%
1 ene 2010 año
16.263 bn
-3.685 bn
-18.47%
1 ene 2011 año
20.06 bn
+3.797 bn
23.35%
1 ene 2012 año
16.59 bn
-3.47 bn
-17.3%
1 ene 2015 año
22.068 bn
+5.478 bn
33.02%
1 ene 2016 año
19.251 bn
-2.816 bn
-12.76%
Ranking de los países por los datos estadísticos actuales


Comentarios: