30
/es/
AIzaSyAYiBZKx7MnpbEhh9jyipgxe19OcubqV5w
April 1, 2024
226150
Portugal
PRT
true
2
1
Market capitalization of listed domestic companies (current US$)
2016,2015,2014,2013,2012,2011,2010,2009,2008,2007,2006,2005,2004,2003,2002,2001,2000,1999,1998
Download
Estadísticas Globales de la Biblioteca →Portugal →

Market capitalization of listed domestic companies (current US$)

Estas estadísticas en otros países:

Arab WorldArgentinaArmeniaAustraliaAustriaAzerbaijanBahrainBangladeshBarbadosBelgiumBermudaBhutanBoliviaBosnia and HerzegovinaBotswanaBrazilBulgariaCanadaCayman IslandsCentral Europe and the BalticsChannel IslandsChileChinaColombiaCosta RicaCote d'IvoireCroatiaCyprusCzech RepublicDenmarkDominican RepublicEarly-demographic dividendEast Asia & PacificEast Asia & Pacific (excluding high income)East Asia & Pacific (IDA & IBRD countries)EcuadorEgypt, Arab Rep.El SalvadorEuro areaEurope & Central AsiaEurope & Central Asia (excluding high income)Europe & Central Asia (IDA & IBRD countries)European UnionFijiFinlandFranceGeorgiaGermanyGhanaGreeceGuyanaHigh incomeHondurasHong Kong SAR, ChinaHungaryIBRD onlyIDA & IBRD totalIDA blendIndiaIndonesiaIran, Islamic Rep.IrelandIsraelItalyJamaicaJapanJordanKazakhstanKenyaKorea, Dem. People’s Rep.Korea, Rep.KuwaitKyrgyz RepublicLate-demographic dividendLatin America & Caribbean Latin America & Caribbean (excluding high income)Latin America & the Caribbean (IDA & IBRD countries)LebanonLow & middle incomeLower middle incomeLuxembourgMacedonia, FYRMalawiMalaysiaMaltaMauritiusMexicoMiddle East & North AfricaMiddle East & North Africa (excluding high income)Middle East & North Africa (IDA & IBRD countries)Middle incomeMoldovaMongoliaMontenegroMoroccoNamibiaNetherlandsNew ZealandNigeriaNorth AmericaNorwayOECD membersOmanPakistanPanamaPapua New GuineaParaguayPeruPhilippinesPolandPortugalPost-demographic dividendQatarRomaniaRussian FederationSaudi ArabiaSerbiaSingaporeSlovak RepublicSloveniaSouth AfricaSouth AsiaSouth Asia (IDA & IBRD)SpainSri LankaSt. Kitts and NevisSub-Saharan Africa Sub-Saharan Africa (excluding high income)Sub-Saharan Africa (IDA & IBRD countries)SwazilandSwedenSwitzerlandTanzaniaThailandTrinidad and TobagoTunisiaTurkeyUgandaUkraineUnited Arab EmiratesUnited KingdomUnited StatesUpper middle incomeUruguayUzbekistanVenezuela, RBVietnamWest Bank and GazaWorldZambiaZimbabwe

línea de tiempo (timeline):

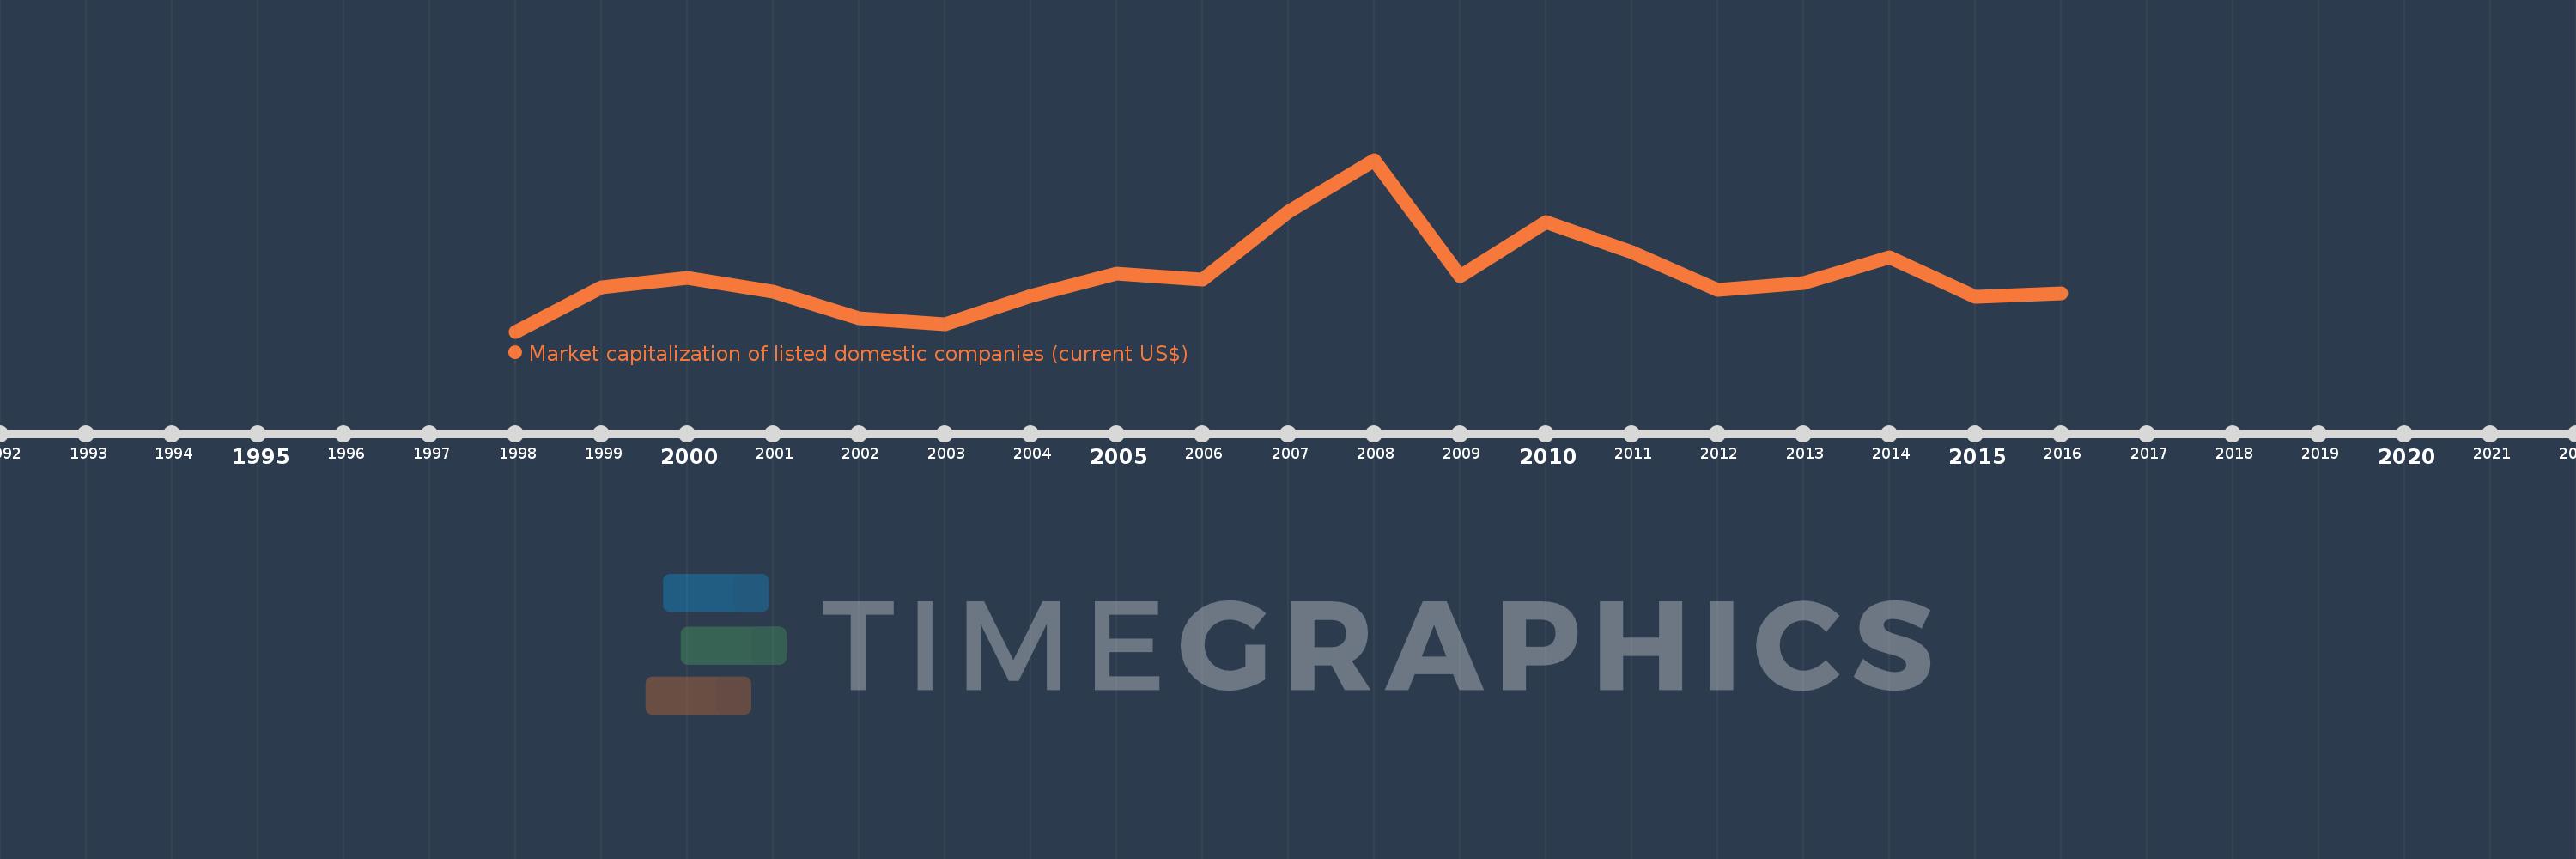
En esta escala de tiempo se presenta un gráfico de 1998 y 2016 de Portugal. Los datos de 1997 están ausentes. El número de observaciones reales por fecha: 19.

Fuente (nombre):

Indicadores del desarrollo mundial

Fuente (organización):

World Federation of Exchanges database.

Categorías:

Financial Sector

Se ha actualizado:

23 abr 2017 año

Los indicadores de los cambios de valor en los últimos años

En promedio:
69.735 bn
Mínimo:
38.953 bn
1 ene 1998 año
Máximo:
132.239 bn
1 ene 2008 año
A la fecha de observación
Valor
Cambio absoluto
El cambio con respecto al valor anterior
1 ene 1998 año
38.953 bn
+38.953 bn
0.0%
1 ene 1999 año
62.954 bn
+24.001 bn
61.61%
1 ene 2000 año
68.148 bn
+5.194 bn
8.25%
1 ene 2001 año
60.681 bn
-7.467 bn
-10.96%
1 ene 2002 año
46.338 bn
-14.343 bn
-23.64%
1 ene 2003 año
42.845 bn
-3.492 bn
-7.54%
1 ene 2004 año
58.285 bn
+15.439 bn
36.04%
1 ene 2005 año
70.24 bn
+11.956 bn
20.51%
1 ene 2006 año
66.973 bn
-3.267 bn
-4.65%
1 ene 2007 año
104.187 bn
+37.214 bn
55.57%
1 ene 2008 año
132.239 bn
+28.051 bn
26.92%
1 ene 2009 año
68.876 bn
-63.363 bn
-47.92%
1 ene 2010 año
98.247 bn
+29.371 bn
42.64%
1 ene 2011 año
81.997 bn
-16.25 bn
-16.54%
1 ene 2012 año
61.69 bn
-20.307 bn
-24.77%
1 ene 2013 año
65.519 bn
+3.829 bn
6.21%
1 ene 2014 año
79.178 bn
+13.659 bn
20.85%
1 ene 2015 año
57.774 bn
-21.404 bn
-27.03%
1 ene 2016 año
59.837 bn
+2.063 bn
3.57%

Ranking de los países por los datos estadísticos actuales