30
/es/
AIzaSyAYiBZKx7MnpbEhh9jyipgxe19OcubqV5w
April 1, 2024
216702
Pakistan
PAK
true
2
1
Market capitalization of listed domestic companies (current US$)
2012,2011,2010,2009,2008,2007,2006,2005,2002,2001,2000,1999,1998,1997,1996,1995,1994
Download
Estadísticas Globales de la Biblioteca →Pakistan →

Market capitalization of listed domestic companies (current US$)

Estas estadísticas en otros países:

Arab WorldArgentinaArmeniaAustraliaAustriaAzerbaijanBahrainBangladeshBarbadosBelgiumBermudaBhutanBoliviaBosnia and HerzegovinaBotswanaBrazilBulgariaCanadaCayman IslandsCentral Europe and the BalticsChannel IslandsChileChinaColombiaCosta RicaCote d'IvoireCroatiaCyprusCzech RepublicDenmarkDominican RepublicEarly-demographic dividendEast Asia & PacificEast Asia & Pacific (excluding high income)East Asia & Pacific (IDA & IBRD countries)EcuadorEgypt, Arab Rep.El SalvadorEuro areaEurope & Central AsiaEurope & Central Asia (excluding high income)Europe & Central Asia (IDA & IBRD countries)European UnionFijiFinlandFranceGeorgiaGermanyGhanaGreeceGuyanaHigh incomeHondurasHong Kong SAR, ChinaHungaryIBRD onlyIDA & IBRD totalIDA blendIndiaIndonesiaIran, Islamic Rep.IrelandIsraelItalyJamaicaJapanJordanKazakhstanKenyaKorea, Dem. People’s Rep.Korea, Rep.KuwaitKyrgyz RepublicLate-demographic dividendLatin America & Caribbean Latin America & Caribbean (excluding high income)Latin America & the Caribbean (IDA & IBRD countries)LebanonLow & middle incomeLower middle incomeLuxembourgMacedonia, FYRMalawiMalaysiaMaltaMauritiusMexicoMiddle East & North AfricaMiddle East & North Africa (excluding high income)Middle East & North Africa (IDA & IBRD countries)Middle incomeMoldovaMongoliaMontenegroMoroccoNamibiaNetherlandsNew ZealandNigeriaNorth AmericaNorwayOECD membersOmanPakistanPanamaPapua New GuineaParaguayPeruPhilippinesPolandPortugalPost-demographic dividendQatarRomaniaRussian FederationSaudi ArabiaSerbiaSingaporeSlovak RepublicSloveniaSouth AfricaSouth AsiaSouth Asia (IDA & IBRD)SpainSri LankaSt. Kitts and NevisSub-Saharan Africa Sub-Saharan Africa (excluding high income)Sub-Saharan Africa (IDA & IBRD countries)SwazilandSwedenSwitzerlandTanzaniaThailandTrinidad and TobagoTunisiaTurkeyUgandaUkraineUnited Arab EmiratesUnited KingdomUnited StatesUpper middle incomeUruguayUzbekistanVenezuela, RBVietnamWest Bank and GazaWorldZambiaZimbabwe

línea de tiempo (timeline):

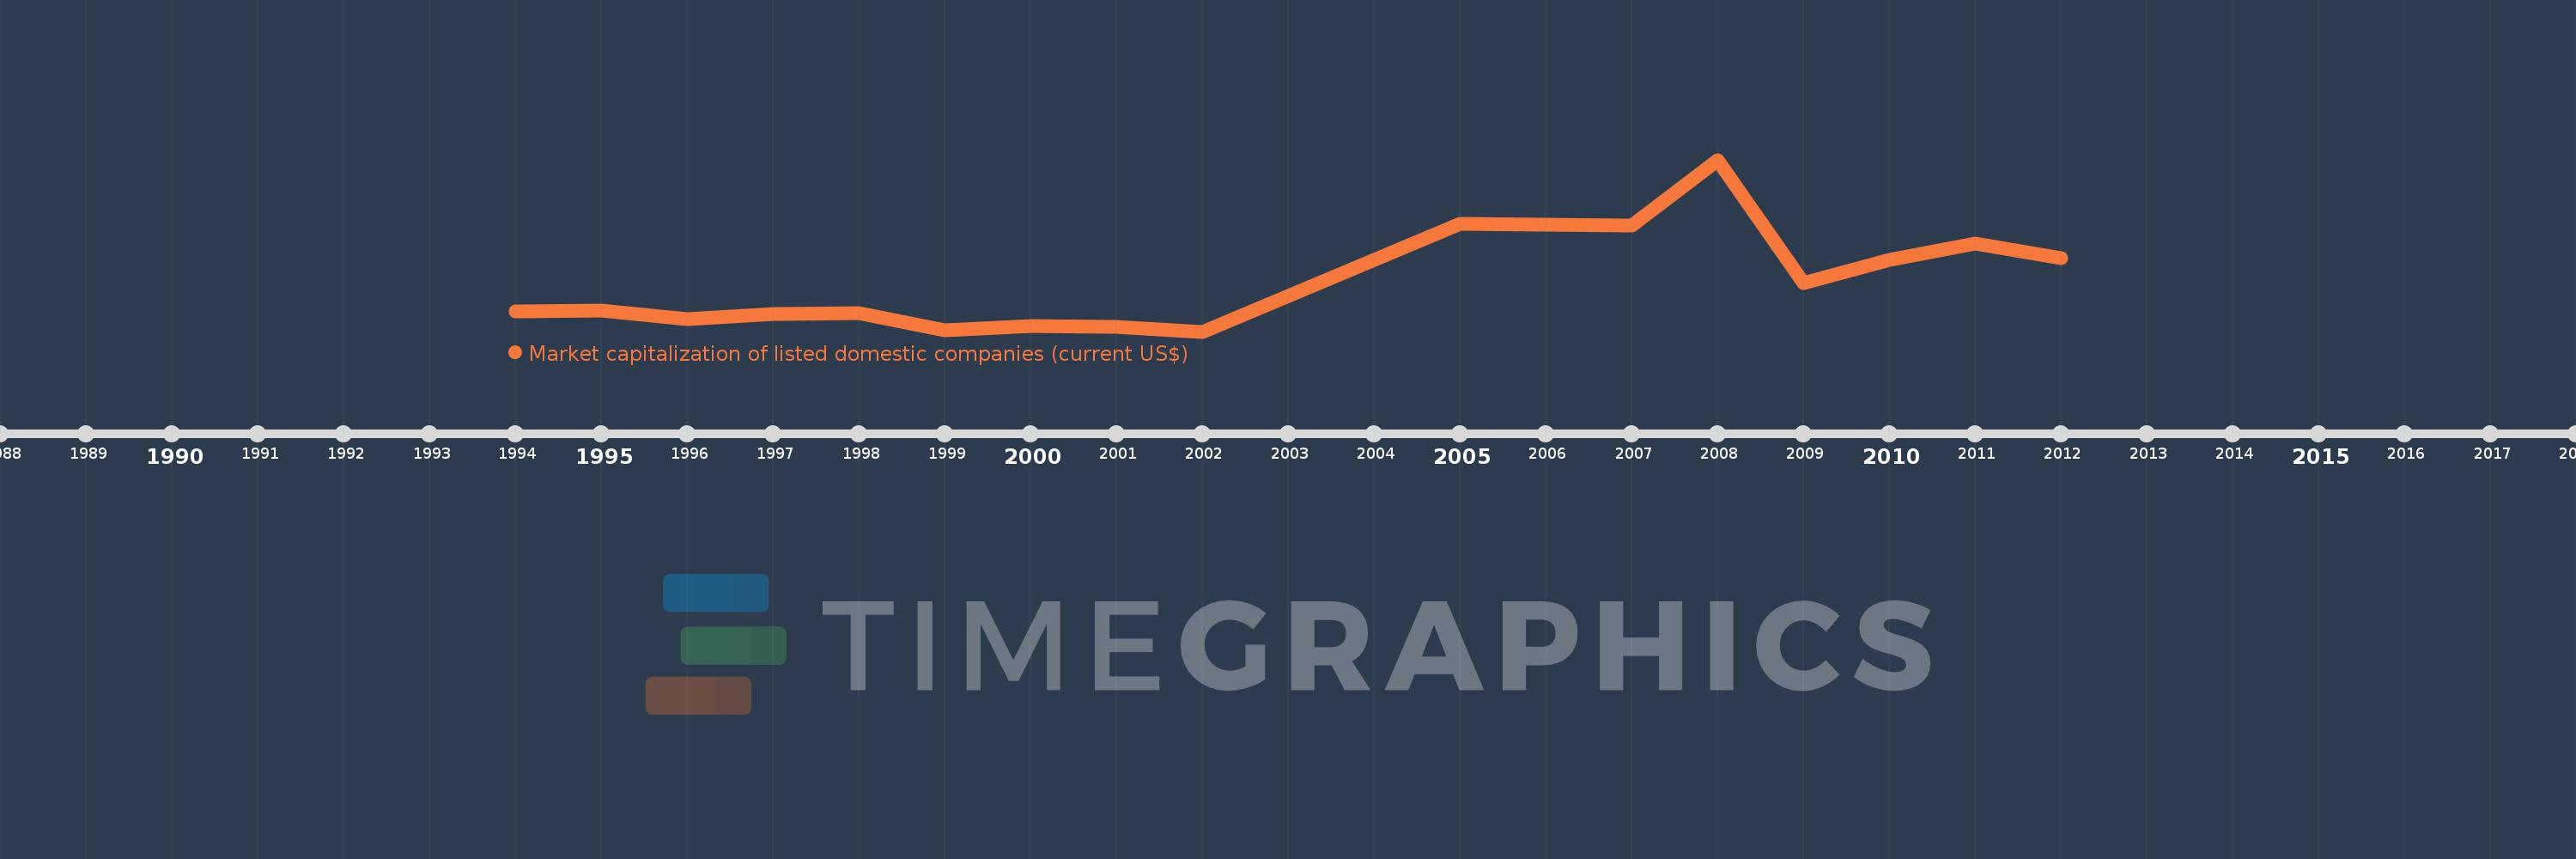
En esta escala de tiempo se presenta un gráfico de 1994 y 2012 de Pakistan. Los datos de 1993 están ausentes. El número de observaciones reales por fecha: 17.

Fuente (nombre):

Indicadores del desarrollo mundial

Fuente (organización):

World Federation of Exchanges database.

Categorías:

Financial Sector

Se ha actualizado:

23 abr 2017 año

Los indicadores de los cambios de valor en los últimos años

En promedio:
24.342 bn
Mínimo:
4.903 bn
1 ene 2002 año
Máximo:
69.715 bn
1 ene 2008 año
A la fecha de observación
Valor
Cambio absoluto
El cambio con respecto al valor anterior
1 ene 1994 año
12.652 bn
+12.652 bn
0.0%
1 ene 1995 año
12.928 bn
+276.1 millones
2.18%
1 ene 1996 año
9.459 bn
-3.469 bn
-26.83%
1 ene 1997 año
11.66 bn
+2.201 bn
23.27%
1 ene 1998 año
11.805 bn
+144.86 millones
1.24%
1 ene 1999 año
5.419 bn
-6.387 bn
-54.1%
1 ene 2000 año
7.008 bn
+1.589 bn
29.33%
1 ene 2001 año
6.625 bn
-383.2 millones
-5.47%
1 ene 2002 año
4.903 bn
-1.721 bn
-25.98%
1 ene 2005 año
45.596 bn
+40.692 bn
829.88%
1 ene 2006 año
45.317 bn
-278.35 millones
-0.61%
1 ene 2007 año
44.906 bn
-410.8 millones
-0.91%
1 ene 2008 año
69.715 bn
+24.809 bn
55.25%
1 ene 2009 año
23.354 bn
-46.361 bn
-66.5%
1 ene 2010 año
31.887 bn
+8.533 bn
36.54%
1 ene 2011 año
38.007 bn
+6.12 bn
19.19%
1 ene 2012 año
32.568 bn
-5.439 bn
-14.31%

Ranking de los países por los datos estadísticos actuales