30
/es/
AIzaSyAYiBZKx7MnpbEhh9jyipgxe19OcubqV5w
April 1, 2024
142057
Greece
GRC
true
2
1
Market capitalization of listed domestic companies (current US$)
2016,2015,2014,2013,2012,2011,2010,2009,2008,2007,2006,2005,2004,2003,2002
Download
Estadísticas Globales de la Biblioteca →Greece →

Market capitalization of listed domestic companies (current US$)

Estas estadísticas en otros países:

Arab WorldArgentinaArmeniaAustraliaAustriaAzerbaijanBahrainBangladeshBarbadosBelgiumBermudaBhutanBoliviaBosnia and HerzegovinaBotswanaBrazilBulgariaCanadaCayman IslandsCentral Europe and the BalticsChannel IslandsChileChinaColombiaCosta RicaCote d'IvoireCroatiaCyprusCzech RepublicDenmarkDominican RepublicEarly-demographic dividendEast Asia & PacificEast Asia & Pacific (excluding high income)East Asia & Pacific (IDA & IBRD countries)EcuadorEgypt, Arab Rep.El SalvadorEuro areaEurope & Central AsiaEurope & Central Asia (excluding high income)Europe & Central Asia (IDA & IBRD countries)European UnionFijiFinlandFranceGeorgiaGermanyGhanaGreeceGuyanaHigh incomeHondurasHong Kong SAR, ChinaHungaryIBRD onlyIDA & IBRD totalIDA blendIndiaIndonesiaIran, Islamic Rep.IrelandIsraelItalyJamaicaJapanJordanKazakhstanKenyaKorea, Dem. People’s Rep.Korea, Rep.KuwaitKyrgyz RepublicLate-demographic dividendLatin America & Caribbean Latin America & Caribbean (excluding high income)Latin America & the Caribbean (IDA & IBRD countries)LebanonLow & middle incomeLower middle incomeLuxembourgMacedonia, FYRMalawiMalaysiaMaltaMauritiusMexicoMiddle East & North AfricaMiddle East & North Africa (excluding high income)Middle East & North Africa (IDA & IBRD countries)Middle incomeMoldovaMongoliaMontenegroMoroccoNamibiaNetherlandsNew ZealandNigeriaNorth AmericaNorwayOECD membersOmanPakistanPanamaPapua New GuineaParaguayPeruPhilippinesPolandPortugalPost-demographic dividendQatarRomaniaRussian FederationSaudi ArabiaSerbiaSingaporeSlovak RepublicSloveniaSouth AfricaSouth AsiaSouth Asia (IDA & IBRD)SpainSri LankaSt. Kitts and NevisSub-Saharan Africa Sub-Saharan Africa (excluding high income)Sub-Saharan Africa (IDA & IBRD countries)SwazilandSwedenSwitzerlandTanzaniaThailandTrinidad and TobagoTunisiaTurkeyUgandaUkraineUnited Arab EmiratesUnited KingdomUnited StatesUpper middle incomeUruguayUzbekistanVenezuela, RBVietnamWest Bank and GazaWorldZambiaZimbabwe

línea de tiempo (timeline):

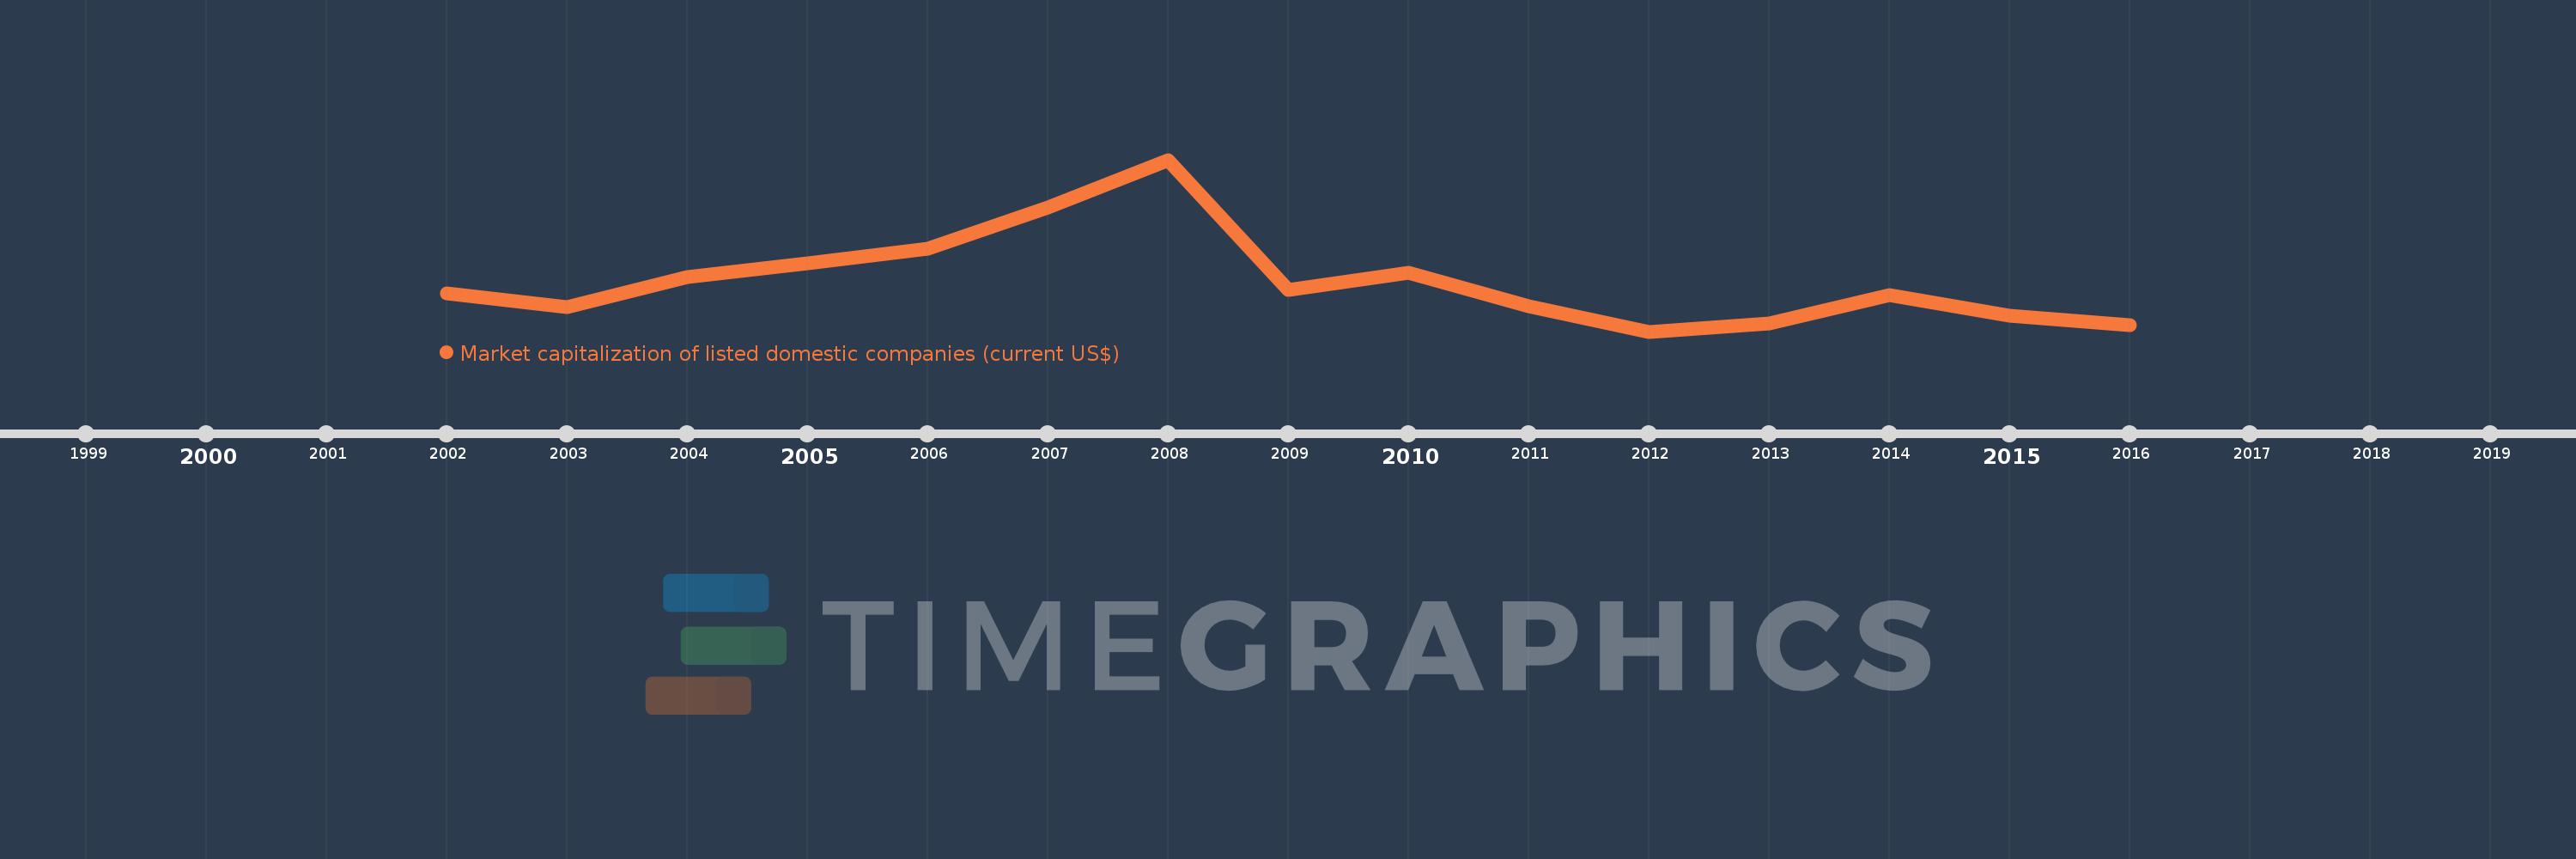
En esta escala de tiempo se presenta un gráfico de 2002 y 2016 de Greece. Los datos de 2001 están ausentes. El número de observaciones reales por fecha: 15.

Fuente (nombre):

Indicadores del desarrollo mundial

Fuente (organización):

World Federation of Exchanges database.

Categorías:

Financial Sector

Se ha actualizado:

23 abr 2017 año

Los indicadores de los cambios de valor en los últimos años

En promedio:
101.559 bn
Mínimo:
33.779 bn
1 ene 2012 año
Máximo:
264.961 bn
1 ene 2008 año
A la fecha de observación
Valor
Cambio absoluto
El cambio con respecto al valor anterior
1 ene 2002 año
84.752 bn
+84.752 bn
0.0%
1 ene 2003 año
67.061 bn
-17.691 bn
-20.87%
1 ene 2004 año
106.644 bn
+39.582 bn
59.02%
1 ene 2005 año
125.242 bn
+18.598 bn
17.44%
1 ene 2006 año
145.121 bn
+19.879 bn
15.87%
1 ene 2007 año
200.696 bn
+55.575 bn
38.3%
1 ene 2008 año
264.961 bn
+64.265 bn
32.02%
1 ene 2009 año
90.2 bn
-174.761 bn
-65.96%
1 ene 2010 año
112.632 bn
+22.432 bn
24.87%
1 ene 2011 año
67.586 bn
-45.046 bn
-39.99%
1 ene 2012 año
33.779 bn
-33.808 bn
-50.02%
1 ene 2013 año
44.877 bn
+11.098 bn
32.85%
1 ene 2014 año
82.594 bn
+37.718 bn
84.05%
1 ene 2015 año
55.154 bn
-27.44 bn
-33.22%
1 ene 2016 año
42.08 bn
-13.075 bn
-23.71%

Ranking de los países por los datos estadísticos actuales