30
/es/
AIzaSyAYiBZKx7MnpbEhh9jyipgxe19OcubqV5w
April 1, 2024
222463
Peru
PER
true
2
1
Market capitalization of listed domestic companies (current US$)
2016,2015,2014,2013,2012,2011,2010,2009,2008,2007,2006,2005,2004,2003,2002,2001,2000,1999,1998
Download
Estadísticas Globales de la Biblioteca →Peru →

Market capitalization of listed domestic companies (current US$)

Estas estadísticas en otros países:

Arab WorldArgentinaArmeniaAustraliaAustriaAzerbaijanBahrainBangladeshBarbadosBelgiumBermudaBhutanBoliviaBosnia and HerzegovinaBotswanaBrazilBulgariaCanadaCayman IslandsCentral Europe and the BalticsChannel IslandsChileChinaColombiaCosta RicaCote d'IvoireCroatiaCyprusCzech RepublicDenmarkDominican RepublicEarly-demographic dividendEast Asia & PacificEast Asia & Pacific (excluding high income)East Asia & Pacific (IDA & IBRD countries)EcuadorEgypt, Arab Rep.El SalvadorEuro areaEurope & Central AsiaEurope & Central Asia (excluding high income)Europe & Central Asia (IDA & IBRD countries)European UnionFijiFinlandFranceGeorgiaGermanyGhanaGreeceGuyanaHigh incomeHondurasHong Kong SAR, ChinaHungaryIBRD onlyIDA & IBRD totalIDA blendIndiaIndonesiaIran, Islamic Rep.IrelandIsraelItalyJamaicaJapanJordanKazakhstanKenyaKorea, Dem. People’s Rep.Korea, Rep.KuwaitKyrgyz RepublicLate-demographic dividendLatin America & Caribbean Latin America & Caribbean (excluding high income)Latin America & the Caribbean (IDA & IBRD countries)LebanonLow & middle incomeLower middle incomeLuxembourgMacedonia, FYRMalawiMalaysiaMaltaMauritiusMexicoMiddle East & North AfricaMiddle East & North Africa (excluding high income)Middle East & North Africa (IDA & IBRD countries)Middle incomeMoldovaMongoliaMontenegroMoroccoNamibiaNetherlandsNew ZealandNigeriaNorth AmericaNorwayOECD membersOmanPakistanPanamaPapua New GuineaParaguayPeruPhilippinesPolandPortugalPost-demographic dividendQatarRomaniaRussian FederationSaudi ArabiaSerbiaSingaporeSlovak RepublicSloveniaSouth AfricaSouth AsiaSouth Asia (IDA & IBRD)SpainSri LankaSt. Kitts and NevisSub-Saharan Africa Sub-Saharan Africa (excluding high income)Sub-Saharan Africa (IDA & IBRD countries)SwazilandSwedenSwitzerlandTanzaniaThailandTrinidad and TobagoTunisiaTurkeyUgandaUkraineUnited Arab EmiratesUnited KingdomUnited StatesUpper middle incomeUruguayUzbekistanVenezuela, RBVietnamWest Bank and GazaWorldZambiaZimbabwe

línea de tiempo (timeline):

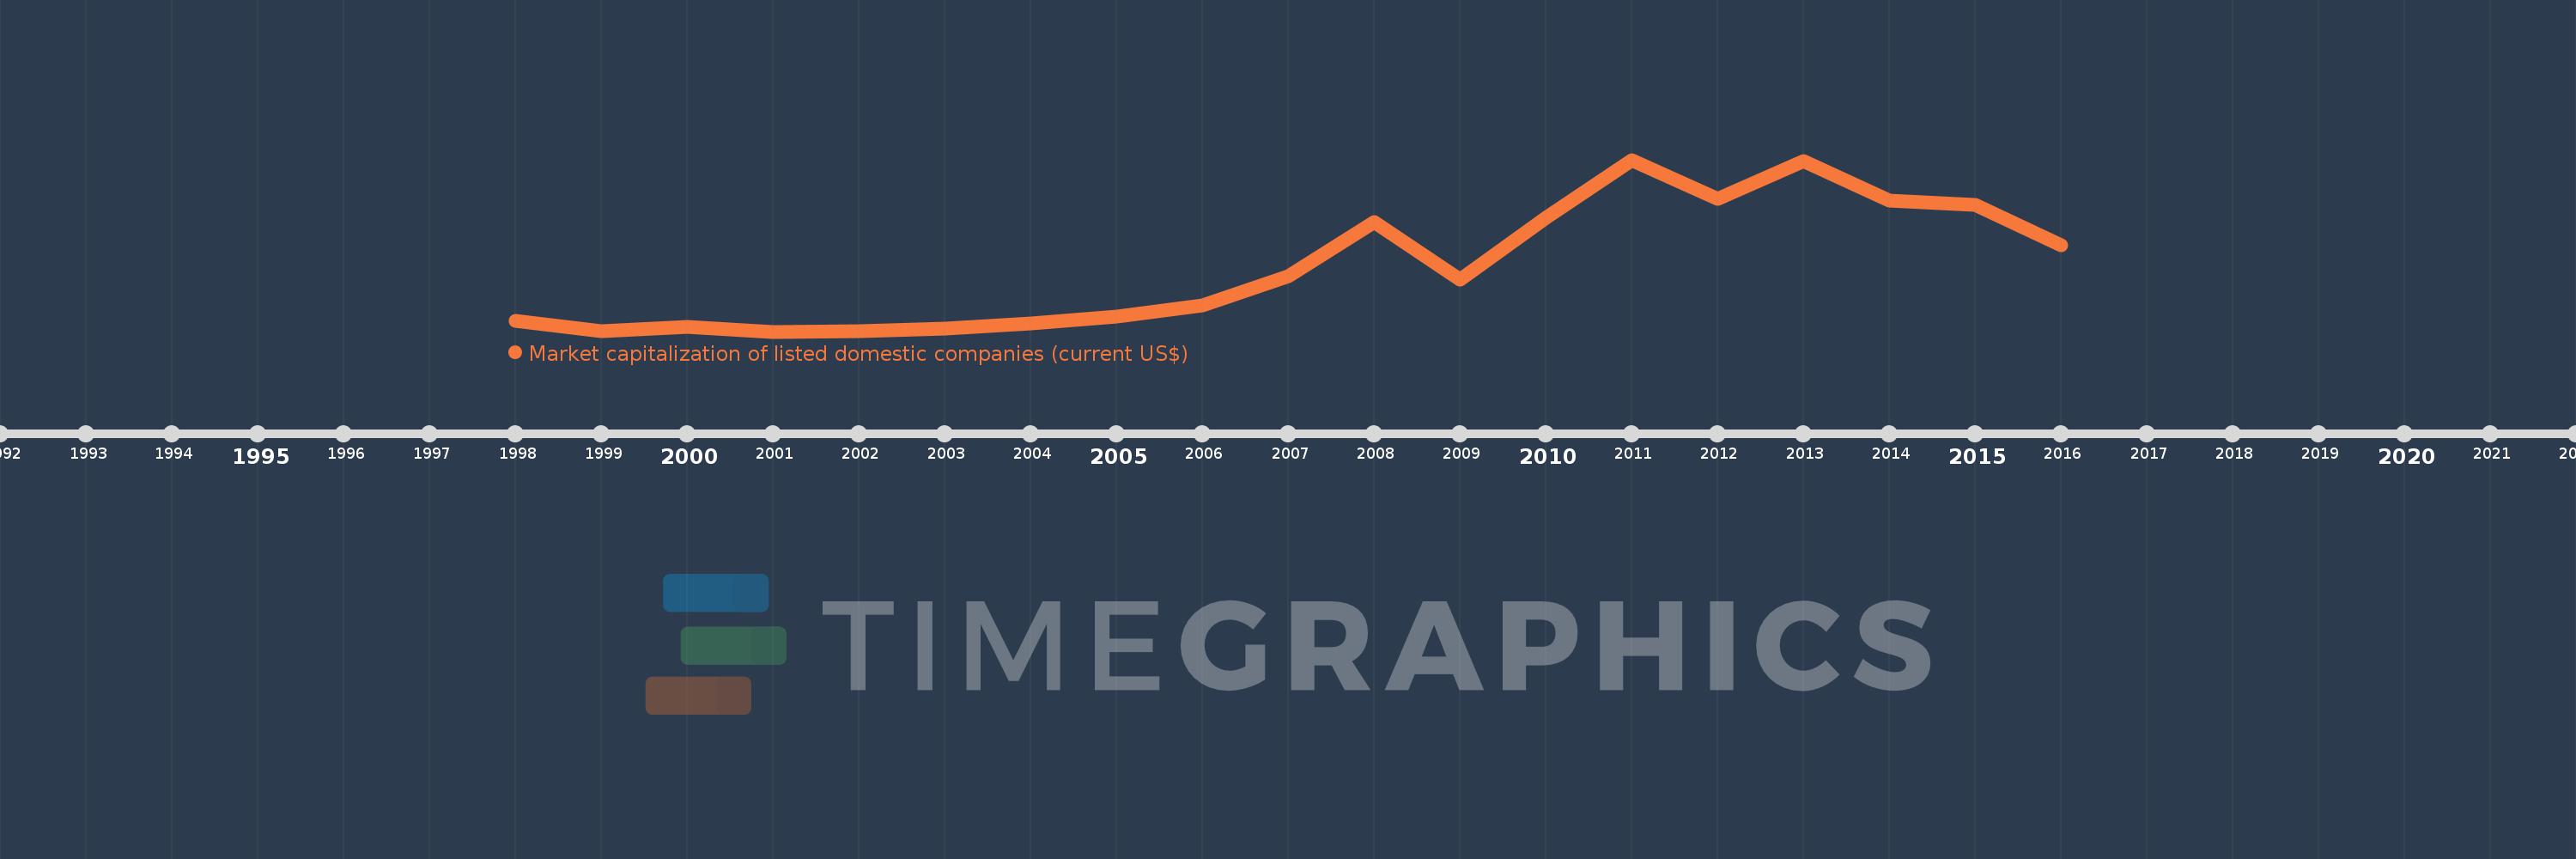
En esta escala de tiempo se presenta un gráfico de 1998 y 2016 de Peru. Los datos de 1997 están ausentes. El número de observaciones reales por fecha: 19.

Fuente (nombre):

Indicadores del desarrollo mundial

Fuente (organización):

World Federation of Exchanges database.

Categorías:

Financial Sector

Se ha actualizado:

23 abr 2017 año

Los indicadores de los cambios de valor en los últimos años

En promedio:
44.628 bn
Mínimo:
9.75 bn
1 ene 2001 año
Máximo:
103.347 bn
1 ene 2011 año
A la fecha de observación
Valor
Cambio absoluto
El cambio con respecto al valor anterior
1 ene 1998 año
15.496 bn
+15.496 bn
0.0%
1 ene 1999 año
9.868 bn
-5.627 bn
-36.32%
1 ene 2000 año
12.092 bn
+2.223 bn
22.53%
1 ene 2001 año
9.75 bn
-2.342 bn
-19.37%
1 ene 2002 año
9.79 bn
+40.42 millones
0.41%
1 ene 2003 año
11.441 bn
+1.651 bn
16.86%
1 ene 2004 año
14.125 bn
+2.684 bn
23.46%
1 ene 2005 año
18.074 bn
+3.949 bn
27.96%
1 ene 2006 año
24.14 bn
+6.066 bn
33.56%
1 ene 2007 año
40.022 bn
+15.882 bn
65.79%
1 ene 2008 año
69.386 bn
+29.365 bn
73.37%
1 ene 2009 año
37.877 bn
-31.51 bn
-45.41%
1 ene 2010 año
71.663 bn
+33.786 bn
89.2%
1 ene 2011 año
103.347 bn
+31.685 bn
44.21%
1 ene 2012 año
81.878 bn
-21.469 bn
-20.77%
1 ene 2013 año
102.617 bn
+20.739 bn
25.33%
1 ene 2014 año
80.978 bn
-21.639 bn
-21.09%
1 ene 2015 año
78.84 bn
-2.138 bn
-2.64%
1 ene 2016 año
56.556 bn
-22.284 bn
-28.27%

Ranking de los países por los datos estadísticos actuales