29
/es/
es
AIzaSyAYiBZKx7MnpbEhh9jyipgxe19OcubqV5w
April 1, 2024
195832
Mexico
MEX
true
2
1
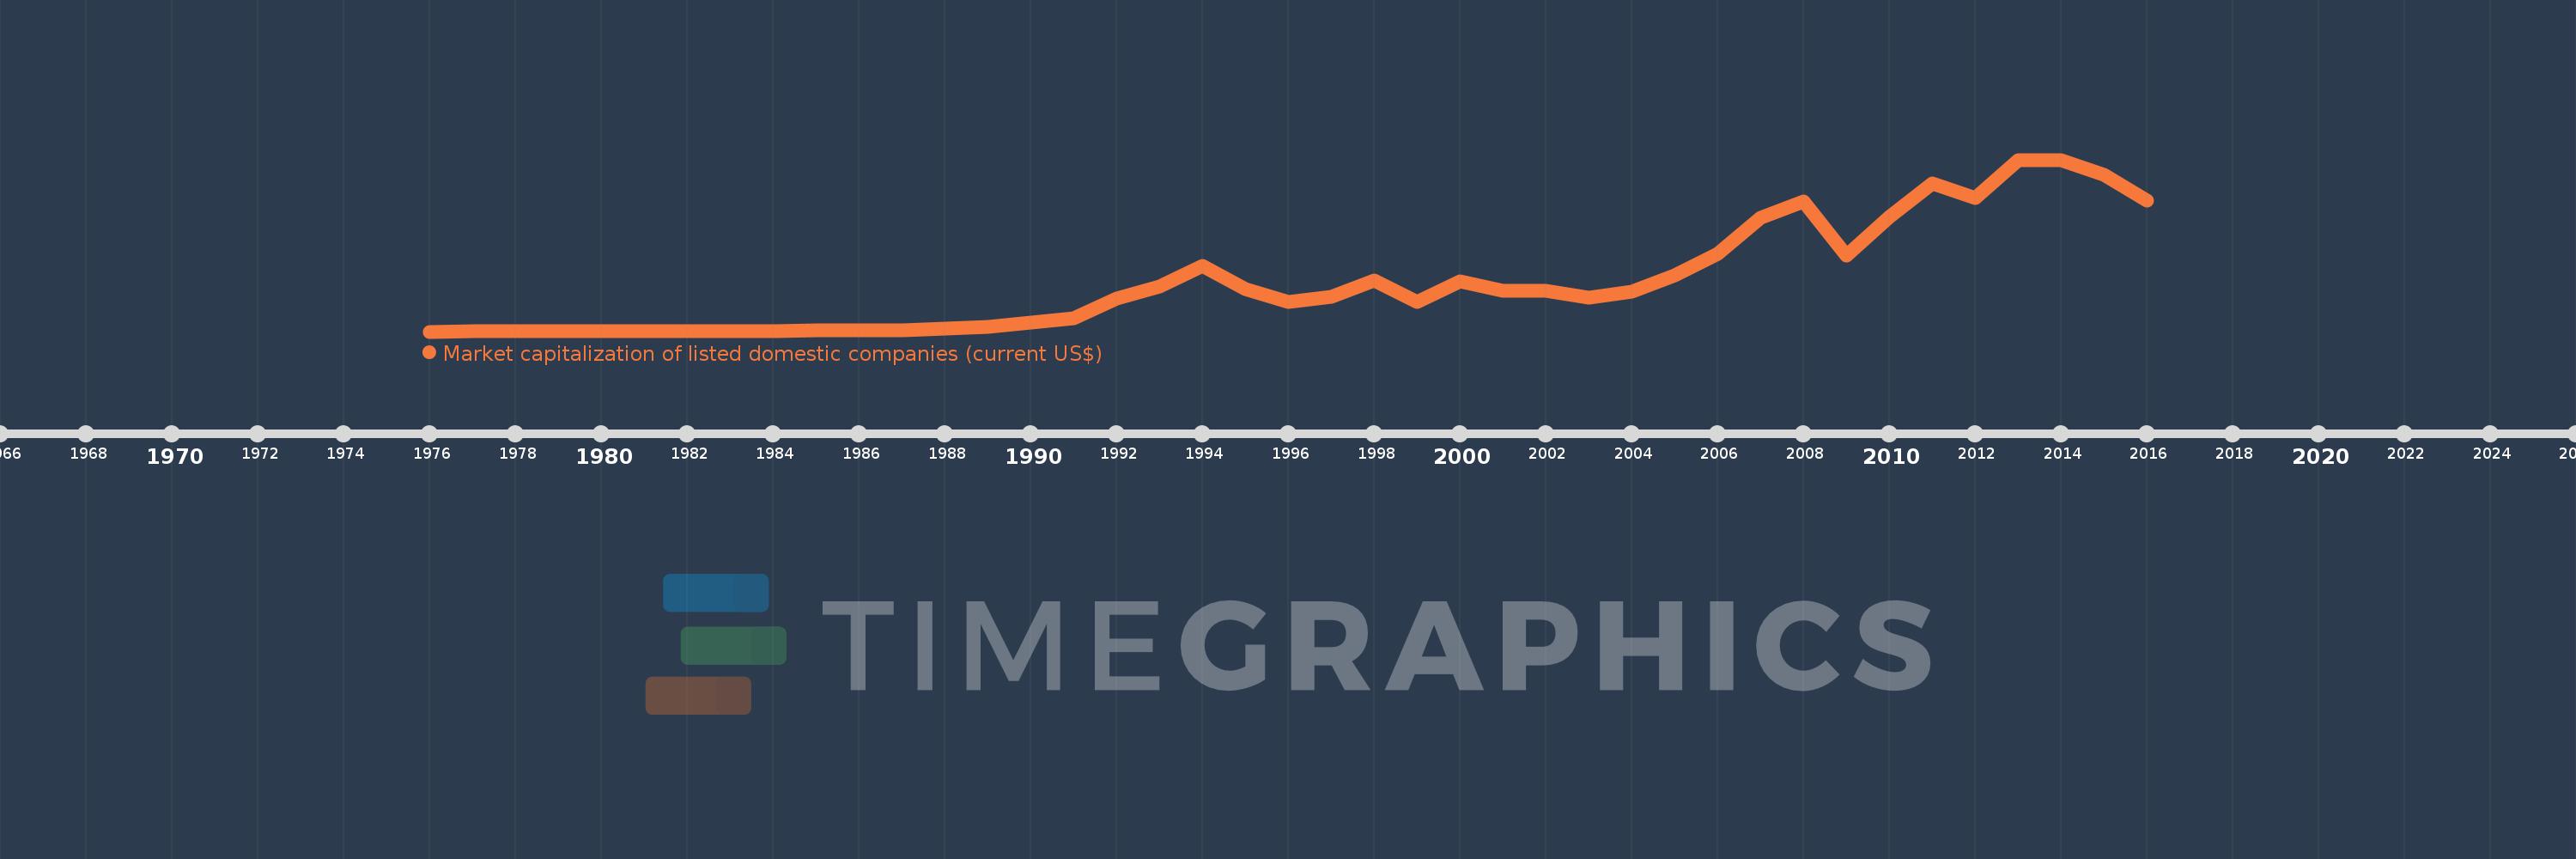
Market capitalization of listed domestic companies (current US$)
2016,2015,2014,2013,2012,2011,2010,2009,2008,2007,2006,2005,2004,2003,2002,2001,2000,1999,1998,1997,1996,1995,1994,1993,1992,1991,1990,1989,1988,1987,1986,1985,1984,1983,1982,1981,1980,1979,1977,1976
Estas estadísticas en otros países:
línea de tiempo (timeline):
En esta escala de tiempo se presenta un gráfico de 1976 y 2016 de Mexico. Los datos de 1975 están ausentes. El número de observaciones reales por fecha: 40.
Fuente (nombre):
Indicadores del desarrollo mundial
Fuente (organización):
World Federation of Exchanges database.
Categorías:
Financial Sector
Se ha actualizado:
23 abr 2017 año
Los indicadores de los cambios de valor en los últimos años
Mínimo:
470.0 millones
1 ene 1976 año
Máximo:
526.016 bn
1 ene 2014 año
A la fecha de observación
Valor
Cambio absoluto
El cambio con respecto al valor anterior
1 ene 1976 año
470.0 millones
+470.0 millones
0.0%
1 ene 1977 año
800.0 millones
+330.0 millones
70.21%
1 ene 1979 año
738.0 millones
-62.0 millones
-7.75%
1 ene 1980 año
1.197 bn
+459.0 millones
62.2%
1 ene 1981 año
1.299 bn
+102.0 millones
8.52%
1 ene 1982 año
1.01 bn
-289.0 millones
-22.25%
1 ene 1983 año
1.72 bn
+710.0 millones
70.3%
1 ene 1984 año
3.03 bn
+1.31 bn
76.16%
1 ene 1985 año
3.66 bn
+630.0 millones
20.79%
1 ene 1986 año
3.91 bn
+250.0 millones
6.83%
1 ene 1987 año
5.52 bn
+1.61 bn
41.18%
1 ene 1988 año
9.05 bn
+3.53 bn
63.95%
1 ene 1989 año
15.2 bn
+6.15 bn
67.96%
1 ene 1990 año
27.08 bn
+11.88 bn
78.16%
1 ene 1991 año
41.05 bn
+13.97 bn
51.59%
1 ene 1992 año
102.76 bn
+61.71 bn
150.33%
1 ene 1993 año
138.744 bn
+35.984 bn
35.02%
1 ene 1994 año
200.865 bn
+62.121 bn
44.77%
1 ene 1995 año
130.246 bn
-70.619 bn
-35.16%
1 ene 1996 año
90.694 bn
-39.552 bn
-30.37%
1 ene 1997 año
106.77 bn
+16.076 bn
17.73%
1 ene 1998 año
156.595 bn
+49.825 bn
46.67%
1 ene 1999 año
91.746 bn
-64.849 bn
-41.41%
1 ene 2000 año
154.044 bn
+62.298 bn
67.9%
1 ene 2001 año
125.204 bn
-28.84 bn
-18.72%
1 ene 2002 año
126.258 bn
+1.055 bn
0.84%
1 ene 2003 año
103.941 bn
-22.317 bn
-17.68%
1 ene 2004 año
122.533 bn
+18.592 bn
17.89%
1 ene 2005 año
171.402 bn
+48.869 bn
39.88%
1 ene 2006 año
239.128 bn
+67.726 bn
39.51%
1 ene 2007 año
348.345 bn
+109.217 bn
45.67%
1 ene 2008 año
397.725 bn
+49.38 bn
14.18%
1 ene 2009 año
234.055 bn
-163.67 bn
-41.15%
1 ene 2010 año
352.045 bn
+117.991 bn
50.41%
1 ene 2011 año
454.345 bn
+102.3 bn
29.06%
1 ene 2012 año
408.69 bn
-45.655 bn
-10.05%
1 ene 2013 año
525.057 bn
+116.367 bn
28.47%
1 ene 2014 año
526.016 bn
+958.96 millones
0.18%
1 ene 2015 año
480.245 bn
-45.77 bn
-8.7%
1 ene 2016 año
402.253 bn
-77.992 bn
-16.24%
Ranking de los países por los datos estadísticos actuales


Comentarios: