29
/es/
es
AIzaSyAYiBZKx7MnpbEhh9jyipgxe19OcubqV5w
April 1, 2024
73731
Austria
AUT
true
2
1
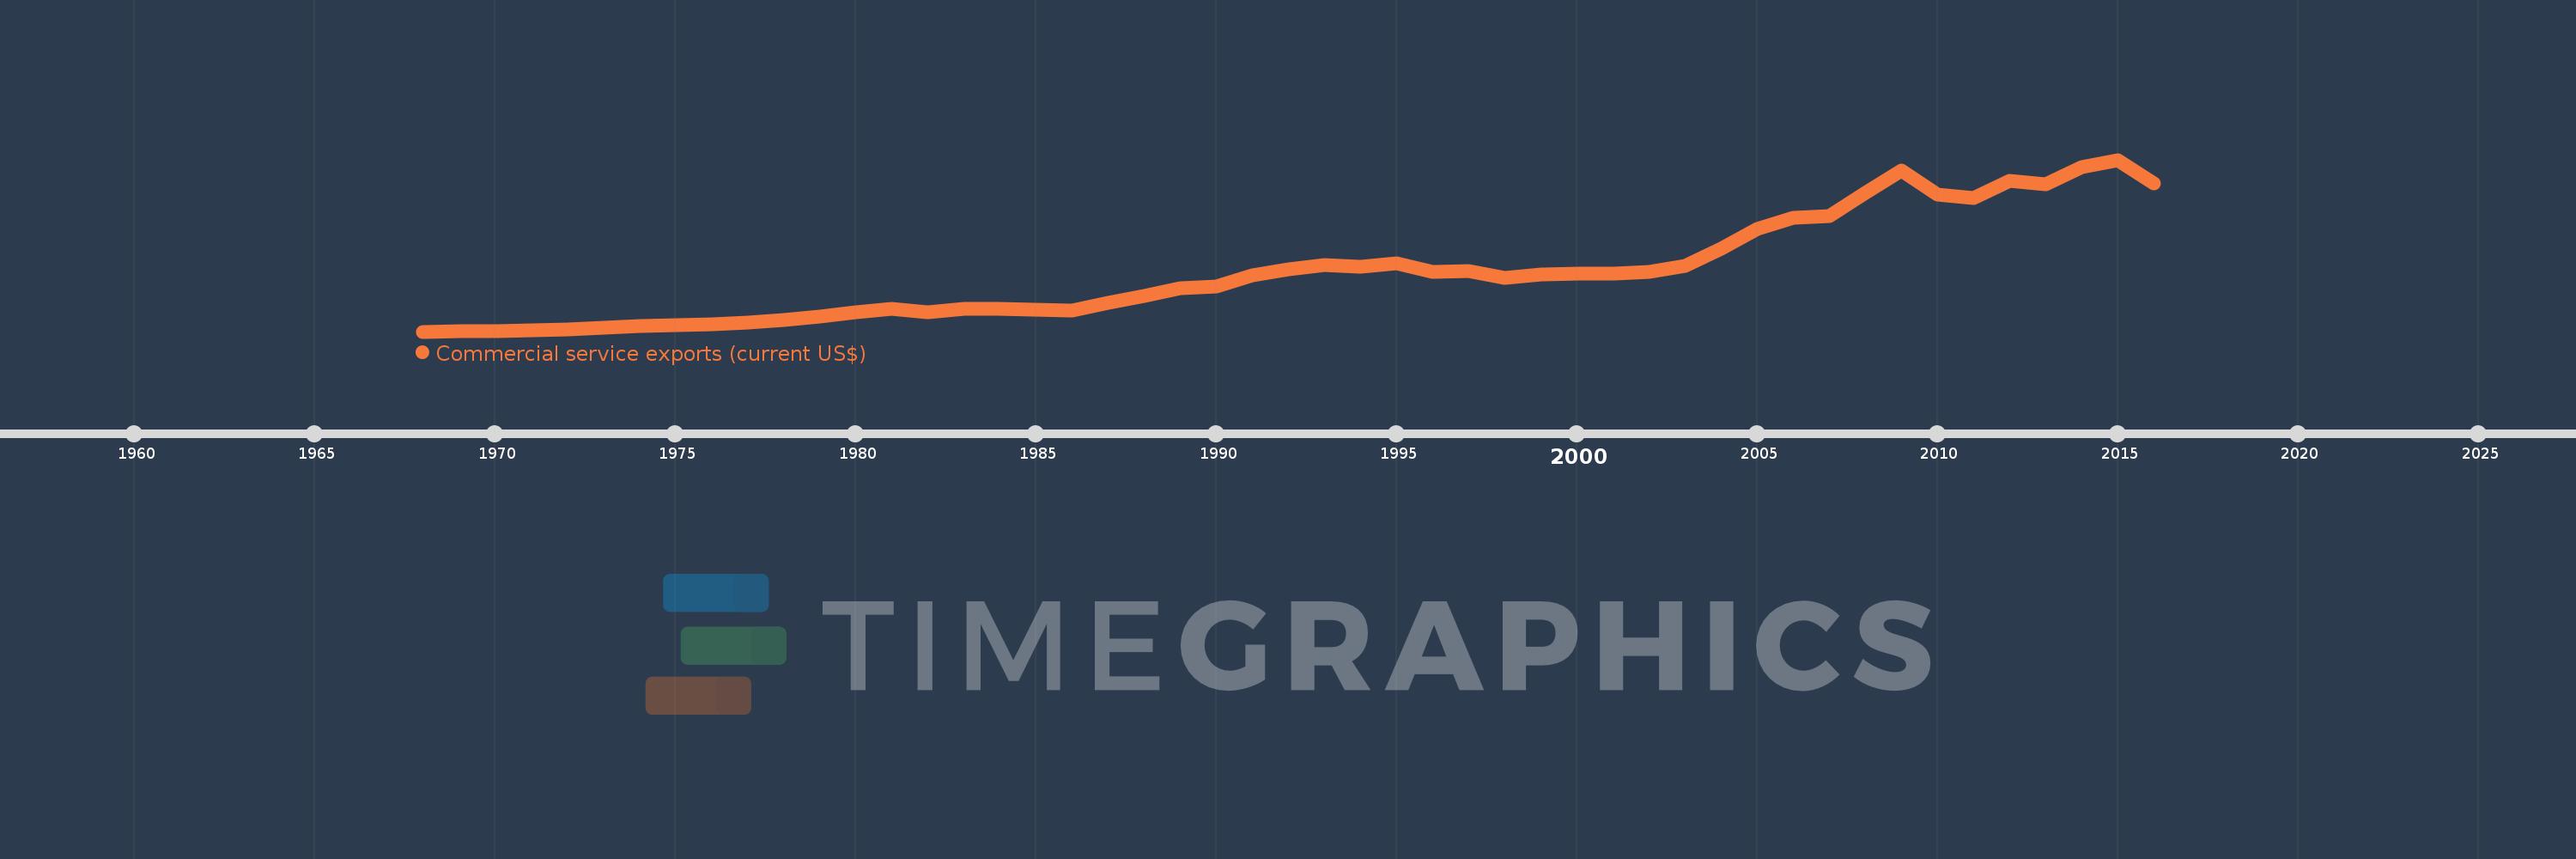
Commercial service exports (current US$)
2016,2015,2014,2013,2012,2011,2010,2009,2008,2007,2006,2005,2004,2003,2002,2001,2000,1999,1998,1997,1996,1995,1994,1993,1992,1991,1990,1989,1988,1987,1986,1985,1984,1983,1982,1981,1980,1979,1978,1977,1976,1975,1974,1973,1972,1971,1970,1969,1968
Estas estadísticas en otros países:
AfghanistanAlbaniaAlgeriaAngolaAntigua and BarbudaArab WorldArgentinaArmeniaArubaAustraliaAustriaAzerbaijanBahamas, TheBahrainBangladeshBarbadosBelarusBelgiumBelizeBeninBermudaBhutanBoliviaBosnia and HerzegovinaBotswanaBrazilBrunei DarussalamBulgariaBurkina FasoBurundiCabo VerdeCambodiaCameroonCanadaCaribbean small statesCentral African RepublicCentral Europe and the BalticsChadChileChinaColombiaComorosCongo, Dem. Rep.Congo, Rep.Costa RicaCote d'IvoireCroatiaCuracaoCyprusCzech RepublicDenmarkDjiboutiDominicaDominican RepublicEarly-demographic dividendEast Asia & PacificEast Asia & Pacific (excluding high income)East Asia & Pacific (IDA & IBRD countries)EcuadorEgypt, Arab Rep.El SalvadorEquatorial GuineaEritreaEstoniaEthiopiaEuro areaEurope & Central AsiaEurope & Central Asia (excluding high income)Europe & Central Asia (IDA & IBRD countries)European UnionFaroe IslandsFijiFinlandFragile and conflict affected situationsFranceFrench PolynesiaGabonGambia, TheGeorgiaGermanyGhanaGreeceGrenadaGuatemalaGuineaGuinea-BissauGuyanaHaitiHeavily indebted poor countries (HIPC)High incomeHondurasHong Kong SAR, ChinaHungaryIBRD onlyIcelandIDA & IBRD totalIDA blendIDA onlyIDA totalIndiaIndonesiaIran, Islamic Rep.IraqIrelandIsraelItalyJamaicaJapanJordanKazakhstanKenyaKiribatiKorea, Rep.KosovoKuwaitKyrgyz RepublicLao PDRLate-demographic dividendLatin America & Caribbean Latin America & Caribbean (excluding high income)Latin America & the Caribbean (IDA & IBRD countries)LatviaLeast developed countries: UN classificationLebanonLesothoLiberiaLibyaLithuaniaLow & middle incomeLow incomeLower middle incomeLuxembourgMacao SAR, ChinaMacedonia, FYRMadagascarMalawiMalaysiaMaldivesMaliMaltaMarshall IslandsMauritaniaMauritiusMexicoMicronesia, Fed. Sts.Middle East & North Africa (excluding high income)Middle East & North Africa (IDA & IBRD countries)Middle incomeMoldovaMongoliaMontenegroMoroccoMozambiqueMyanmarNamibiaNepalNetherlandsNew CaledoniaNew ZealandNicaraguaNigerNigeriaNorth AmericaNorwayOECD membersOmanPacific island small statesPakistanPalauPanamaPapua New GuineaParaguayPeruPhilippinesPolandPortugalPost-demographic dividendPre-demographic dividendQatarRomaniaRussian FederationRwandaSamoaSao Tome and PrincipeSaudi ArabiaSenegalSerbiaSeychellesSierra LeoneSingaporeSint Maarten (Dutch part)Slovak RepublicSloveniaSolomon IslandsSouth AfricaSouth AsiaSouth Asia (IDA & IBRD)South SudanSpainSri LankaSt. Kitts and NevisSt. LuciaSt. Vincent and the GrenadinesSub-Saharan Africa Sub-Saharan Africa (excluding high income)Sub-Saharan Africa (IDA & IBRD countries)SudanSurinameSwazilandSwedenSwitzerlandSyrian Arab RepublicTajikistanTanzaniaThailandTimor-LesteTogoTongaTrinidad and TobagoTunisiaTurkeyTuvaluUgandaUkraineUnited KingdomUnited StatesUpper middle incomeUruguayVanuatuVenezuela, RBVietnamWest Bank and GazaWorldYemen, Rep.ZambiaZimbabwe línea de tiempo (timeline):
En esta escala de tiempo se presenta un gráfico de 1968 y 2016 de Austria. Los datos de 1967 están ausentes. El número de observaciones reales por fecha: 49.
Fuente (nombre):
Indicadores del desarrollo mundial
Fuente (organización):
International Monetary Fund, Balance of Payments Statistics Yearbook and data files.
Categorías:
Private Sector, Trade
Se ha actualizado:
23 abr 2017 año
Los indicadores de los cambios de valor en los últimos años
Mínimo:
834.5 millones
1 ene 1968 año
Máximo:
66.668 bn
1 ene 2015 año
A la fecha de observación
Valor
Cambio absoluto
El cambio con respecto al valor anterior
1 ene 1968 año
834.5 millones
+834.5 millones
0.0%
1 ene 1969 año
934.962 millones
+100.462 millones
12.04%
1 ene 1970 año
1.101 bn
+166.538 millones
17.81%
1 ene 1971 año
1.361 bn
+259.423 millones
23.55%
1 ene 1972 año
1.739 bn
+377.715 millones
27.75%
1 ene 1973 año
2.255 bn
+516.535 millones
29.71%
1 ene 1974 año
3.069 bn
+814.15 millones
36.1%
1 ene 1975 año
3.216 bn
+147.122 millones
4.79%
1 ene 1976 año
3.796 bn
+579.469 millones
18.02%
1 ene 1977 año
4.362 bn
+566.477 millones
14.92%
1 ene 1978 año
5.221 bn
+858.507 millones
19.68%
1 ene 1979 año
6.646 bn
+1.425 bn
27.29%
1 ene 1980 año
8.186 bn
+1.54 bn
23.17%
1 ene 1981 año
9.623 bn
+1.437 bn
17.55%
1 ene 1982 año
8.364 bn
-1.259 bn
-13.08%
1 ene 1983 año
9.448 bn
+1.084 bn
12.96%
1 ene 1984 año
9.615 bn
+167.136 millones
1.77%
1 ene 1985 año
9.083 bn
-531.653 millones
-5.53%
1 ene 1986 año
9.061 bn
-21.952 millones
-0.24%
1 ene 1987 año
11.946 bn
+2.885 bn
31.84%
1 ene 1988 año
14.531 bn
+2.585 bn
21.64%
1 ene 1989 año
17.313 bn
+2.783 bn
19.15%
1 ene 1990 año
17.963 bn
+649.396 millones
3.75%
1 ene 1991 año
22.392 bn
+4.429 bn
24.66%
1 ene 1992 año
24.76 bn
+2.368 bn
10.58%
1 ene 1993 año
26.473 bn
+1.713 bn
6.92%
1 ene 1994 año
25.785 bn
-687.531 millones
-2.6%
1 ene 1995 año
27.107 bn
+1.322 bn
5.13%
1 ene 1996 año
23.679 bn
-3.428 bn
-12.65%
1 ene 1997 año
23.963 bn
+283.979 millones
1.2%
1 ene 1998 año
21.431 bn
-2.532 bn
-10.57%
1 ene 1999 año
22.751 bn
+1.32 bn
6.16%
1 ene 2000 año
23.089 bn
+337.94 millones
1.49%
1 ene 2001 año
22.94 bn
-148.446 millones
-0.64%
1 ene 2002 año
23.574 bn
+633.966 millones
2.76%
1 ene 2003 año
25.963 bn
+2.389 bn
10.13%
1 ene 2004 año
32.596 bn
+6.633 bn
25.55%
1 ene 2005 año
40.261 bn
+7.665 bn
23.52%
1 ene 2006 año
44.572 bn
+4.311 bn
10.71%
1 ene 2007 año
45.138 bn
+565.545 millones
1.27%
1 ene 2008 año
53.872 bn
+8.735 bn
19.35%
1 ene 2009 año
62.465 bn
+8.592 bn
15.95%
1 ene 2010 año
53.303 bn
-9.162 bn
-14.67%
1 ene 2011 año
52.178 bn
-1.125 bn
-2.11%
1 ene 2012 año
58.564 bn
+6.386 bn
12.24%
1 ene 2013 año
57.333 bn
-1.231 bn
-2.1%
1 ene 2014 año
63.919 bn
+6.586 bn
11.49%
1 ene 2015 año
66.668 bn
+2.749 bn
4.3%
1 ene 2016 año
57.643 bn
-9.025 bn
-13.54%
Ranking de los países por los datos estadísticos actuales


Comentarios: