29
/es/
es
AIzaSyAYiBZKx7MnpbEhh9jyipgxe19OcubqV5w
April 1, 2024
29725
Euro area
EMU
false
2
1
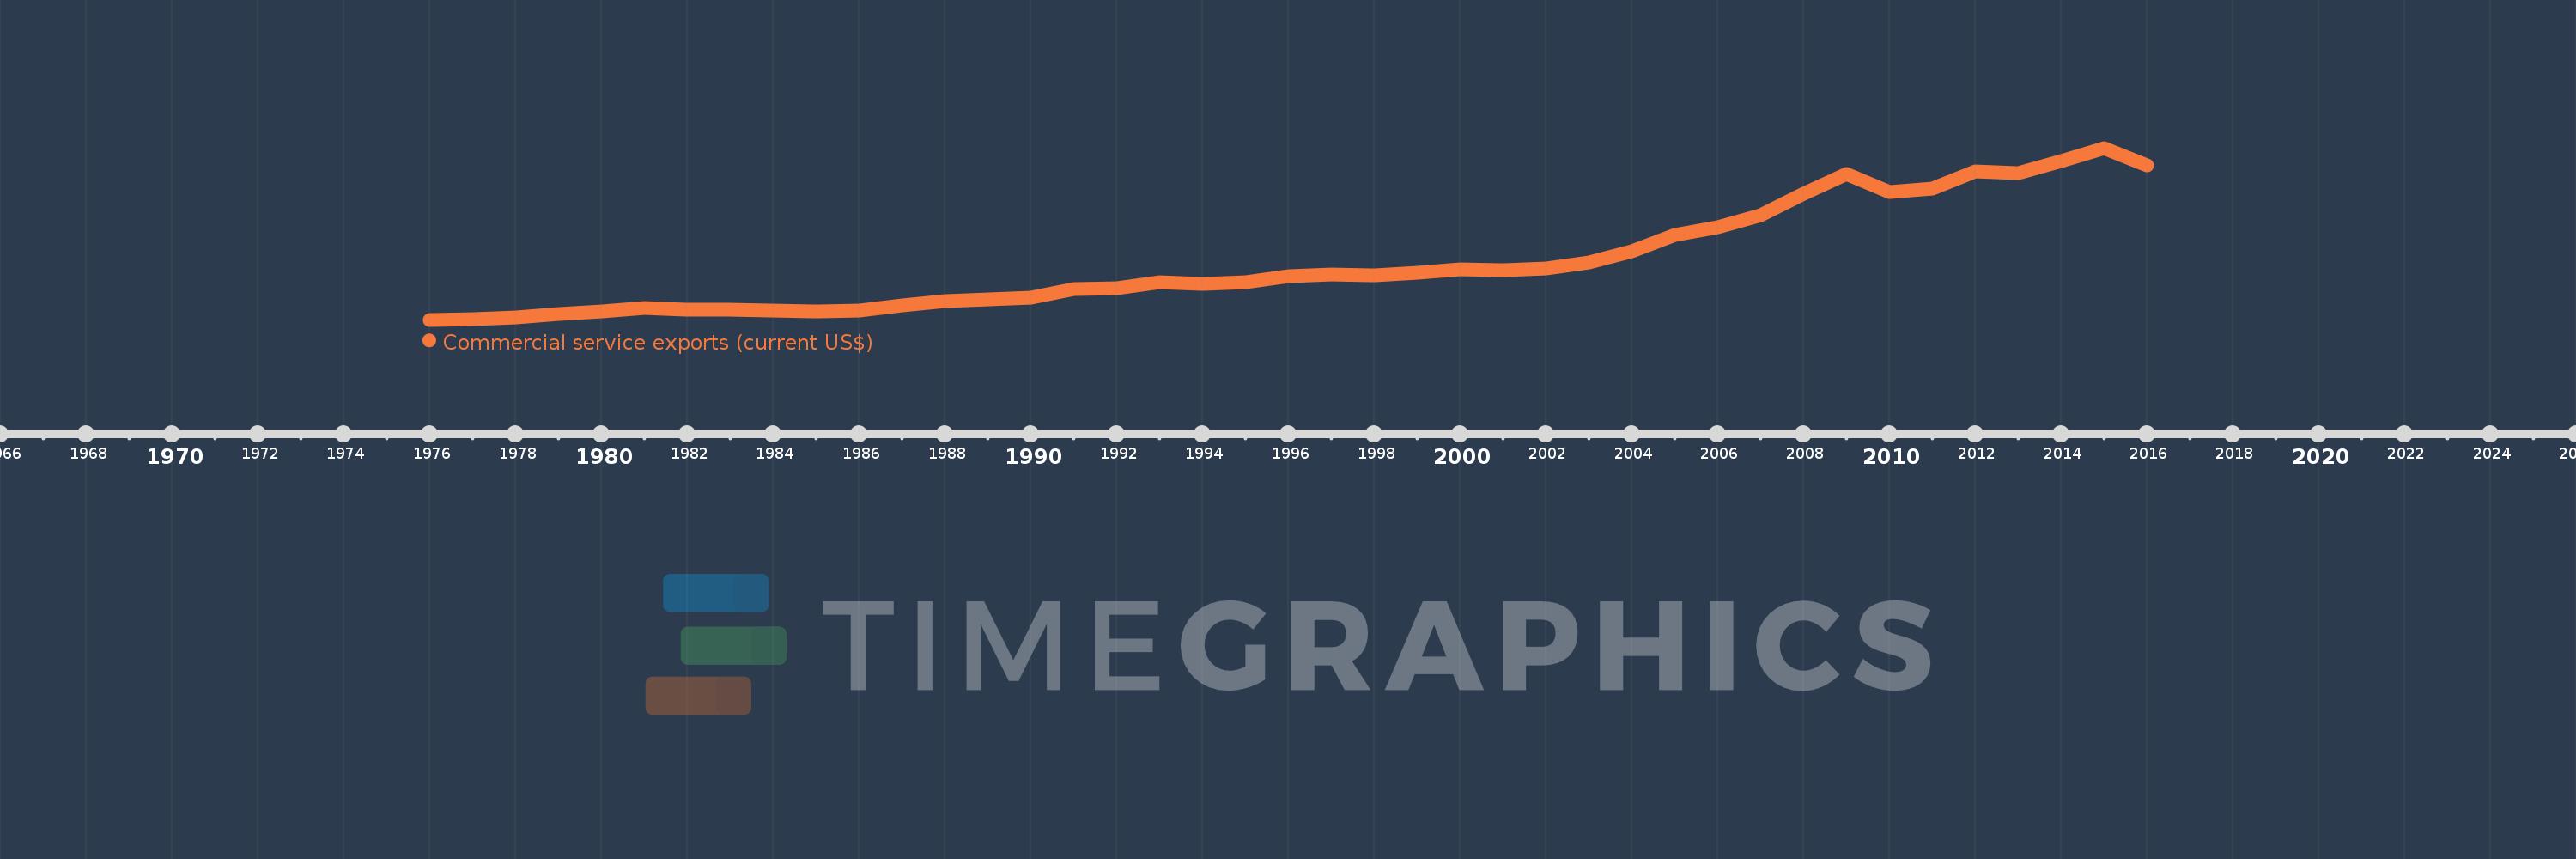
Commercial service exports (current US$)
2016,2015,2014,2013,2012,2011,2010,2009,2008,2007,2006,2005,2004,2003,2002,2001,2000,1999,1998,1997,1996,1995,1994,1993,1992,1991,1990,1989,1988,1987,1986,1985,1984,1983,1982,1981,1980,1979,1978,1977,1976
Estas estadísticas en otros países:
AfghanistanAlbaniaAlgeriaAngolaAntigua and BarbudaArab WorldArgentinaArmeniaArubaAustraliaAustriaAzerbaijanBahamas, TheBahrainBangladeshBarbadosBelarusBelgiumBelizeBeninBermudaBhutanBoliviaBosnia and HerzegovinaBotswanaBrazilBrunei DarussalamBulgariaBurkina FasoBurundiCabo VerdeCambodiaCameroonCanadaCaribbean small statesCentral African RepublicCentral Europe and the BalticsChadChileChinaColombiaComorosCongo, Dem. Rep.Congo, Rep.Costa RicaCote d'IvoireCroatiaCuracaoCyprusCzech RepublicDenmarkDjiboutiDominicaDominican RepublicEarly-demographic dividendEast Asia & PacificEast Asia & Pacific (excluding high income)East Asia & Pacific (IDA & IBRD countries)EcuadorEgypt, Arab Rep.El SalvadorEquatorial GuineaEritreaEstoniaEthiopiaEuro areaEurope & Central AsiaEurope & Central Asia (excluding high income)Europe & Central Asia (IDA & IBRD countries)European UnionFaroe IslandsFijiFinlandFragile and conflict affected situationsFranceFrench PolynesiaGabonGambia, TheGeorgiaGermanyGhanaGreeceGrenadaGuatemalaGuineaGuinea-BissauGuyanaHaitiHeavily indebted poor countries (HIPC)High incomeHondurasHong Kong SAR, ChinaHungaryIBRD onlyIcelandIDA & IBRD totalIDA blendIDA onlyIDA totalIndiaIndonesiaIran, Islamic Rep.IraqIrelandIsraelItalyJamaicaJapanJordanKazakhstanKenyaKiribatiKorea, Rep.KosovoKuwaitKyrgyz RepublicLao PDRLate-demographic dividendLatin America & Caribbean Latin America & Caribbean (excluding high income)Latin America & the Caribbean (IDA & IBRD countries)LatviaLeast developed countries: UN classificationLebanonLesothoLiberiaLibyaLithuaniaLow & middle incomeLow incomeLower middle incomeLuxembourgMacao SAR, ChinaMacedonia, FYRMadagascarMalawiMalaysiaMaldivesMaliMaltaMarshall IslandsMauritaniaMauritiusMexicoMicronesia, Fed. Sts.Middle East & North Africa (excluding high income)Middle East & North Africa (IDA & IBRD countries)Middle incomeMoldovaMongoliaMontenegroMoroccoMozambiqueMyanmarNamibiaNepalNetherlandsNew CaledoniaNew ZealandNicaraguaNigerNigeriaNorth AmericaNorwayOECD membersOmanPacific island small statesPakistanPalauPanamaPapua New GuineaParaguayPeruPhilippinesPolandPortugalPost-demographic dividendPre-demographic dividendQatarRomaniaRussian FederationRwandaSamoaSao Tome and PrincipeSaudi ArabiaSenegalSerbiaSeychellesSierra LeoneSingaporeSint Maarten (Dutch part)Slovak RepublicSloveniaSolomon IslandsSouth AfricaSouth AsiaSouth Asia (IDA & IBRD)South SudanSpainSri LankaSt. Kitts and NevisSt. LuciaSt. Vincent and the GrenadinesSub-Saharan Africa Sub-Saharan Africa (excluding high income)Sub-Saharan Africa (IDA & IBRD countries)SudanSurinameSwazilandSwedenSwitzerlandSyrian Arab RepublicTajikistanTanzaniaThailandTimor-LesteTogoTongaTrinidad and TobagoTunisiaTurkeyTuvaluUgandaUkraineUnited KingdomUnited StatesUpper middle incomeUruguayVanuatuVenezuela, RBVietnamWest Bank and GazaWorldYemen, Rep.ZambiaZimbabwe línea de tiempo (timeline):
En esta escala de tiempo se presenta un gráfico de 1976 y 2016 de Euro area. Los datos de 1975 están ausentes. El número de observaciones reales por fecha: 41.
Fuente (nombre):
Indicadores del desarrollo mundial
Fuente (organización):
International Monetary Fund, Balance of Payments Statistics Yearbook and data files.
Categorías:
Private Sector, Trade
Se ha actualizado:
23 abr 2017 año
Los indicadores de los cambios de valor en los últimos años
Mínimo:
65.975 bn
1 ene 1976 año
Máximo:
1.544 billones
1 ene 2015 año
A la fecha de observación
Valor
Cambio absoluto
El cambio con respecto al valor anterior
1 ene 1976 año
65.975 bn
+65.975 bn
0.0%
1 ene 1977 año
73.911 bn
+7.937 bn
12.03%
1 ene 1978 año
88.553 bn
+14.642 bn
19.81%
1 ene 1979 año
112.604 bn
+24.051 bn
27.16%
1 ene 1980 año
136.194 bn
+23.589 bn
20.95%
1 ene 1981 año
163.884 bn
+27.69 bn
20.33%
1 ene 1982 año
153.788 bn
-10.096 bn
-6.16%
1 ene 1983 año
148.978 bn
-4.81 bn
-3.13%
1 ene 1984 año
142.915 bn
-6.063 bn
-4.07%
1 ene 1985 año
141.068 bn
-1.847 bn
-1.29%
1 ene 1986 año
147.681 bn
+6.613 bn
4.69%
1 ene 1987 año
186.413 bn
+38.732 bn
26.23%
1 ene 1988 año
224.856 bn
+38.443 bn
20.62%
1 ene 1989 año
241.676 bn
+16.82 bn
7.48%
1 ene 1990 año
256.378 bn
+14.702 bn
6.08%
1 ene 1991 año
330.441 bn
+74.063 bn
28.89%
1 ene 1992 año
337.034 bn
+6.593 bn
2.0%
1 ene 1993 año
390.541 bn
+53.507 bn
15.88%
1 ene 1994 año
372.267 bn
-18.274 bn
-4.68%
1 ene 1995 año
387.647 bn
+15.38 bn
4.13%
1 ene 1996 año
439.183 bn
+51.535 bn
13.29%
1 ene 1997 año
451.69 bn
+12.507 bn
2.85%
1 ene 1998 año
446.178 bn
-5.511 bn
-1.22%
1 ene 1999 año
472.547 bn
+26.369 bn
5.91%
1 ene 2000 año
496.423 bn
+23.876 bn
5.05%
1 ene 2001 año
489.498 bn
-6.925 bn
-1.39%
1 ene 2002 año
504.922 bn
+15.424 bn
3.15%
1 ene 2003 año
557.807 bn
+52.885 bn
10.47%
1 ene 2004 año
655.593 bn
+97.786 bn
17.53%
1 ene 2005 año
795.61 bn
+140.017 bn
21.36%
1 ene 2006 año
862.487 bn
+66.877 bn
8.41%
1 ene 2007 año
962.096 bn
+99.61 bn
11.55%
1 ene 2008 año
1.152 billones
+190.194 bn
19.77%
1 ene 2009 año
1.316 billones
+164.064 bn
14.24%
1 ene 2010 año
1.164 billones
-152.417 bn
-11.58%
1 ene 2011 año
1.192 billones
+28.509 bn
2.45%
1 ene 2012 año
1.342 billones
+149.905 bn
12.57%
1 ene 2013 año
1.326 billones
-16.7 bn
-1.24%
1 ene 2014 año
1.433 billones
+107.506 bn
8.11%
1 ene 2015 año
1.544 billones
+110.56 bn
7.71%
1 ene 2016 año
1.393 billones
-150.856 bn
-9.77%
Ranking de los países por los datos estadísticos actuales


Comentarios: