29
/es/
es
AIzaSyAYiBZKx7MnpbEhh9jyipgxe19OcubqV5w
April 1, 2024
240282
Singapore
SGP
true
2
1
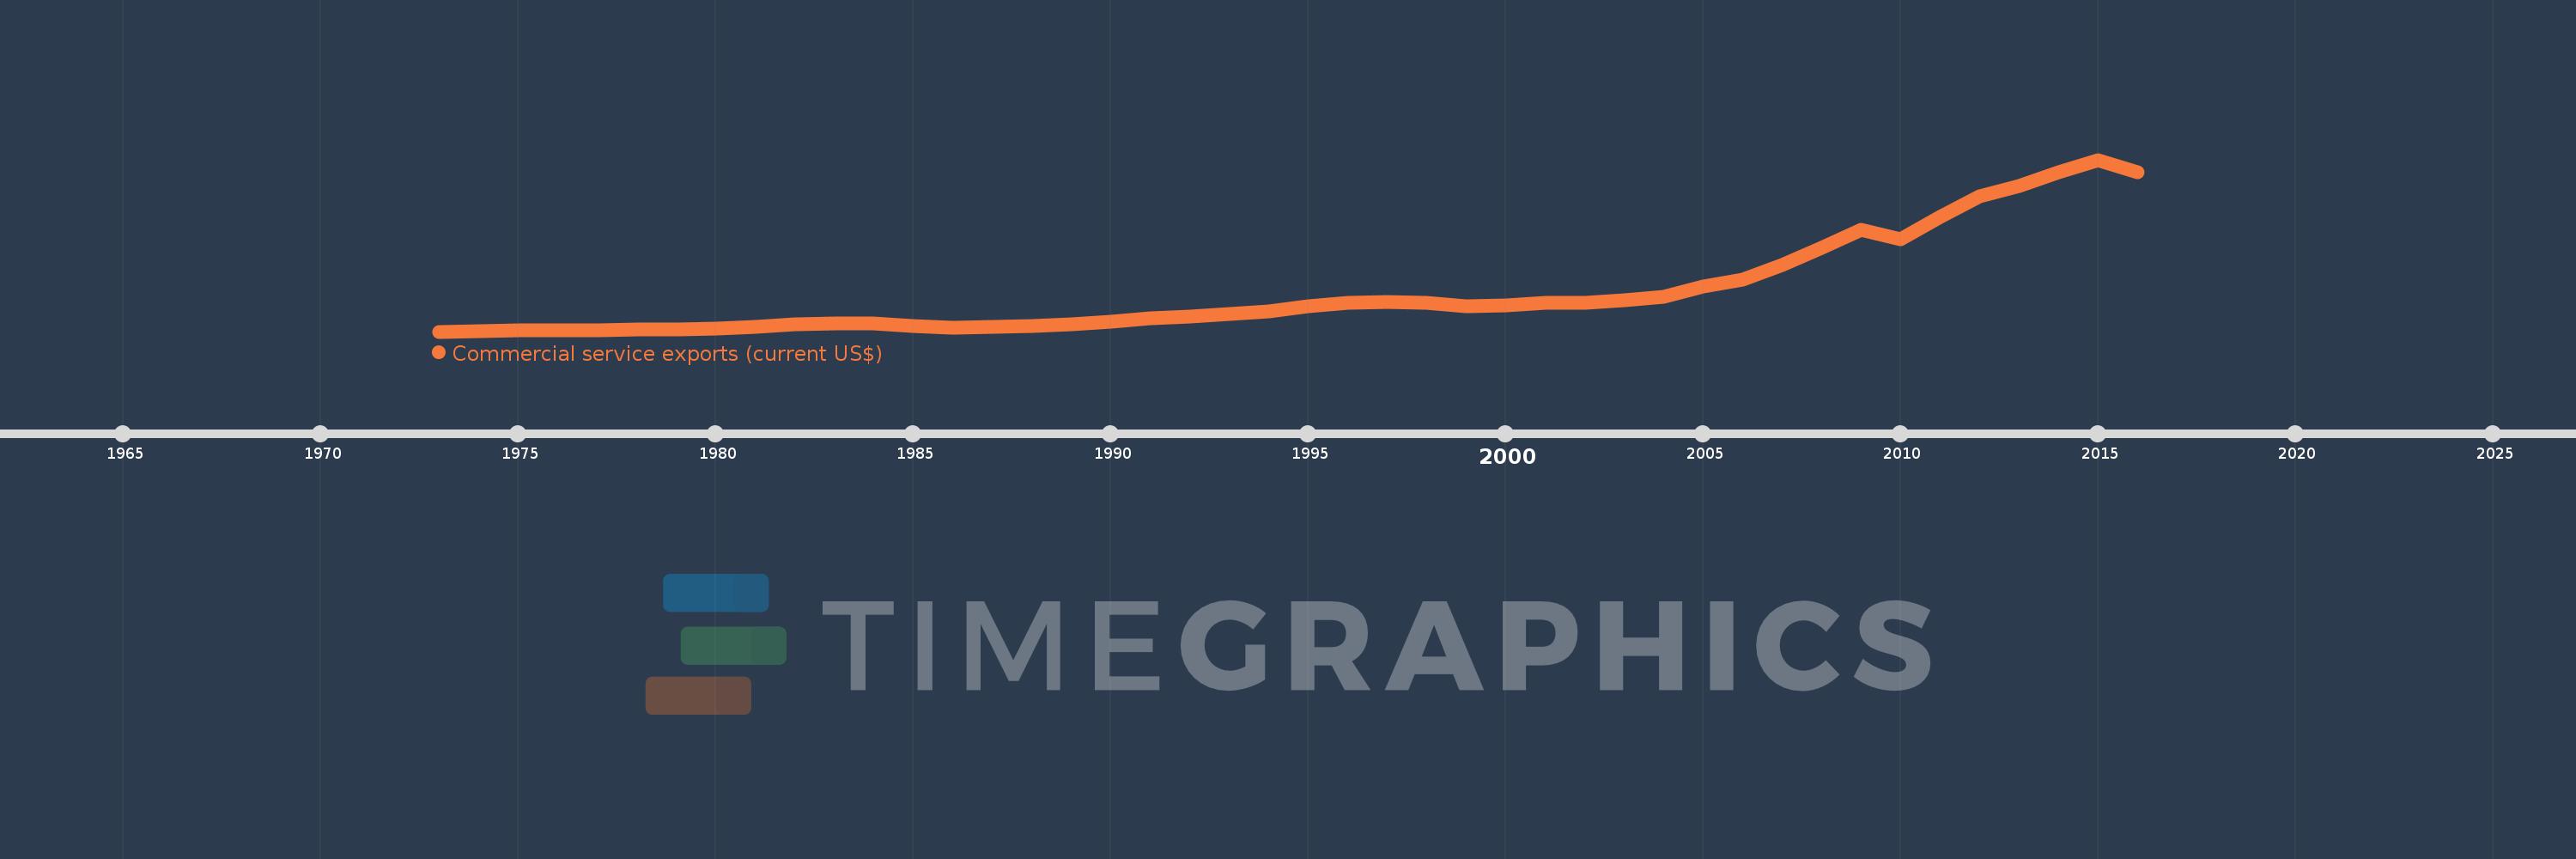
Commercial service exports (current US$)
2016,2015,2014,2013,2012,2011,2010,2009,2008,2007,2006,2005,2004,2003,2002,2001,2000,1999,1998,1997,1996,1995,1994,1993,1992,1991,1990,1989,1988,1987,1986,1985,1984,1983,1982,1981,1980,1979,1978,1977,1976,1975,1974,1973
Estas estadísticas en otros países:
AfghanistanAlbaniaAlgeriaAngolaAntigua and BarbudaArab WorldArgentinaArmeniaArubaAustraliaAustriaAzerbaijanBahamas, TheBahrainBangladeshBarbadosBelarusBelgiumBelizeBeninBermudaBhutanBoliviaBosnia and HerzegovinaBotswanaBrazilBrunei DarussalamBulgariaBurkina FasoBurundiCabo VerdeCambodiaCameroonCanadaCaribbean small statesCentral African RepublicCentral Europe and the BalticsChadChileChinaColombiaComorosCongo, Dem. Rep.Congo, Rep.Costa RicaCote d'IvoireCroatiaCuracaoCyprusCzech RepublicDenmarkDjiboutiDominicaDominican RepublicEarly-demographic dividendEast Asia & PacificEast Asia & Pacific (excluding high income)East Asia & Pacific (IDA & IBRD countries)EcuadorEgypt, Arab Rep.El SalvadorEquatorial GuineaEritreaEstoniaEthiopiaEuro areaEurope & Central AsiaEurope & Central Asia (excluding high income)Europe & Central Asia (IDA & IBRD countries)European UnionFaroe IslandsFijiFinlandFragile and conflict affected situationsFranceFrench PolynesiaGabonGambia, TheGeorgiaGermanyGhanaGreeceGrenadaGuatemalaGuineaGuinea-BissauGuyanaHaitiHeavily indebted poor countries (HIPC)High incomeHondurasHong Kong SAR, ChinaHungaryIBRD onlyIcelandIDA & IBRD totalIDA blendIDA onlyIDA totalIndiaIndonesiaIran, Islamic Rep.IraqIrelandIsraelItalyJamaicaJapanJordanKazakhstanKenyaKiribatiKorea, Rep.KosovoKuwaitKyrgyz RepublicLao PDRLate-demographic dividendLatin America & Caribbean Latin America & Caribbean (excluding high income)Latin America & the Caribbean (IDA & IBRD countries)LatviaLeast developed countries: UN classificationLebanonLesothoLiberiaLibyaLithuaniaLow & middle incomeLow incomeLower middle incomeLuxembourgMacao SAR, ChinaMacedonia, FYRMadagascarMalawiMalaysiaMaldivesMaliMaltaMarshall IslandsMauritaniaMauritiusMexicoMicronesia, Fed. Sts.Middle East & North Africa (excluding high income)Middle East & North Africa (IDA & IBRD countries)Middle incomeMoldovaMongoliaMontenegroMoroccoMozambiqueMyanmarNamibiaNepalNetherlandsNew CaledoniaNew ZealandNicaraguaNigerNigeriaNorth AmericaNorwayOECD membersOmanPacific island small statesPakistanPalauPanamaPapua New GuineaParaguayPeruPhilippinesPolandPortugalPost-demographic dividendPre-demographic dividendQatarRomaniaRussian FederationRwandaSamoaSao Tome and PrincipeSaudi ArabiaSenegalSerbiaSeychellesSierra LeoneSingaporeSint Maarten (Dutch part)Slovak RepublicSloveniaSolomon IslandsSouth AfricaSouth AsiaSouth Asia (IDA & IBRD)South SudanSpainSri LankaSt. Kitts and NevisSt. LuciaSt. Vincent and the GrenadinesSub-Saharan Africa Sub-Saharan Africa (excluding high income)Sub-Saharan Africa (IDA & IBRD countries)SudanSurinameSwazilandSwedenSwitzerlandSyrian Arab RepublicTajikistanTanzaniaThailandTimor-LesteTogoTongaTrinidad and TobagoTunisiaTurkeyTuvaluUgandaUkraineUnited KingdomUnited StatesUpper middle incomeUruguayVanuatuVenezuela, RBVietnamWest Bank and GazaWorldYemen, Rep.ZambiaZimbabwe línea de tiempo (timeline):
En esta escala de tiempo se presenta un gráfico de 1973 y 2016 de Singapore. Los datos de 1972 están ausentes. El número de observaciones reales por fecha: 44.
Fuente (nombre):
Indicadores del desarrollo mundial
Fuente (organización):
International Monetary Fund, Balance of Payments Statistics Yearbook and data files.
Categorías:
Private Sector, Trade
Se ha actualizado:
23 abr 2017 año
Los indicadores de los cambios de valor en los últimos años
Mínimo:
896.711 millones
1 ene 1973 año
Máximo:
150.449 bn
1 ene 2015 año
A la fecha de observación
Valor
Cambio absoluto
El cambio con respecto al valor anterior
1 ene 1973 año
896.711 millones
+896.711 millones
0.0%
1 ene 1974 año
1.293 bn
+396.543 millones
44.22%
1 ene 1975 año
1.845 bn
+551.328 millones
42.63%
1 ene 1976 año
2.34 bn
+495.063 millones
26.84%
1 ene 1977 año
2.325 bn
-14.931 millones
-0.64%
1 ene 1978 año
2.553 bn
+228.373 millones
9.82%
1 ene 1979 año
3.081 bn
+528.234 millones
20.69%
1 ene 1980 año
3.546 bn
+464.227 millones
15.07%
1 ene 1981 año
4.774 bn
+1.229 bn
34.66%
1 ene 1982 año
7.086 bn
+2.312 bn
48.42%
1 ene 1983 año
8.024 bn
+937.517 millones
13.23%
1 ene 1984 año
7.733 bn
-290.84 millones
-3.62%
1 ene 1985 año
6.044 bn
-1.689 bn
-21.84%
1 ene 1986 año
4.597 bn
-1.447 bn
-23.94%
1 ene 1987 año
4.717 bn
+119.644 millones
2.6%
1 ene 1988 año
5.704 bn
+987.261 millones
20.93%
1 ene 1989 año
7.467 bn
+1.763 bn
30.9%
1 ene 1990 año
9.57 bn
+2.103 bn
28.16%
1 ene 1991 año
12.719 bn
+3.149 bn
32.91%
1 ene 1992 año
13.73 bn
+1.011 bn
7.95%
1 ene 1993 año
16.102 bn
+2.372 bn
17.28%
1 ene 1994 año
18.498 bn
+2.395 bn
14.88%
1 ene 1995 año
22.939 bn
+4.442 bn
24.01%
1 ene 1996 año
25.87 bn
+2.93 bn
12.77%
1 ene 1997 año
27.015 bn
+1.145 bn
4.43%
1 ene 1998 año
26.228 bn
-787.216 millones
-2.91%
1 ene 1999 año
22.67 bn
-3.558 bn
-13.57%
1 ene 2000 año
23.985 bn
+1.315 bn
5.8%
1 ene 2001 año
25.847 bn
+1.861 bn
7.76%
1 ene 2002 año
25.94 bn
+93.405 millones
0.36%
1 ene 2003 año
27.872 bn
+1.932 bn
7.45%
1 ene 2004 año
31.064 bn
+3.192 bn
11.45%
1 ene 2005 año
40.282 bn
+9.218 bn
29.67%
1 ene 2006 año
46.243 bn
+5.961 bn
14.8%
1 ene 2007 año
59.013 bn
+12.77 bn
27.61%
1 ene 2008 año
73.995 bn
+14.982 bn
25.39%
1 ene 2009 año
89.421 bn
+15.426 bn
20.85%
1 ene 2010 año
81.593 bn
-7.827 bn
-8.75%
1 ene 2011 año
100.574 bn
+18.981 bn
23.26%
1 ene 2012 año
118.649 bn
+18.075 bn
17.97%
1 ene 2013 año
127.475 bn
+8.826 bn
7.44%
1 ene 2014 año
139.955 bn
+12.48 bn
9.79%
1 ene 2015 año
150.449 bn
+10.494 bn
7.5%
1 ene 2016 año
139.335 bn
-11.114 bn
-7.39%
Ranking de los países por los datos estadísticos actuales


Comentarios: