29
/es/
es
AIzaSyAYiBZKx7MnpbEhh9jyipgxe19OcubqV5w
April 1, 2024
61430
Upper middle income
UMC
false
2
1
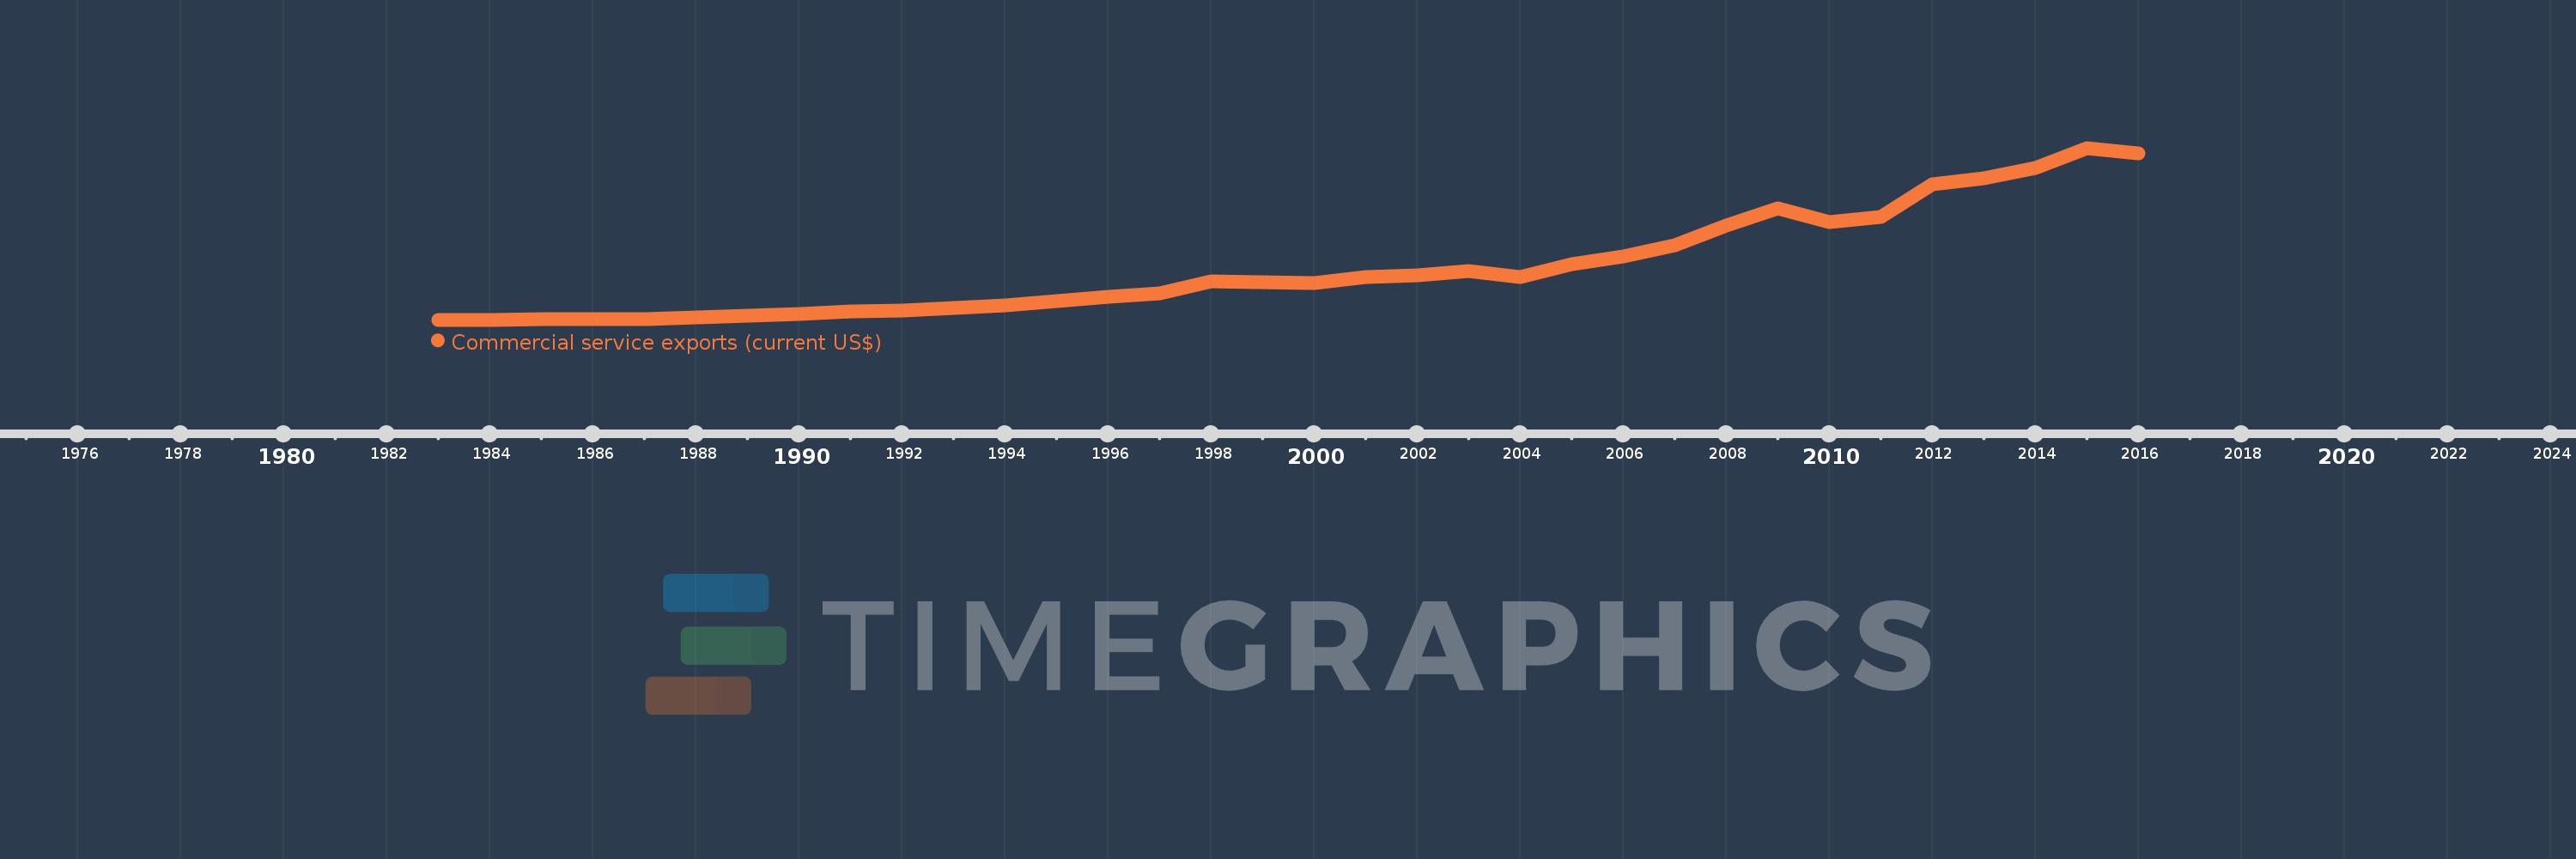
Commercial service exports (current US$)
2016,2015,2014,2013,2012,2011,2010,2009,2008,2007,2006,2005,2004,2003,2002,2001,2000,1999,1998,1997,1996,1995,1994,1993,1992,1991,1990,1989,1988,1987,1986,1985,1984,1983
Estas estadísticas en otros países:
AfghanistanAlbaniaAlgeriaAngolaAntigua and BarbudaArab WorldArgentinaArmeniaArubaAustraliaAustriaAzerbaijanBahamas, TheBahrainBangladeshBarbadosBelarusBelgiumBelizeBeninBermudaBhutanBoliviaBosnia and HerzegovinaBotswanaBrazilBrunei DarussalamBulgariaBurkina FasoBurundiCabo VerdeCambodiaCameroonCanadaCaribbean small statesCentral African RepublicCentral Europe and the BalticsChadChileChinaColombiaComorosCongo, Dem. Rep.Congo, Rep.Costa RicaCote d'IvoireCroatiaCuracaoCyprusCzech RepublicDenmarkDjiboutiDominicaDominican RepublicEarly-demographic dividendEast Asia & PacificEast Asia & Pacific (excluding high income)East Asia & Pacific (IDA & IBRD countries)EcuadorEgypt, Arab Rep.El SalvadorEquatorial GuineaEritreaEstoniaEthiopiaEuro areaEurope & Central AsiaEurope & Central Asia (excluding high income)Europe & Central Asia (IDA & IBRD countries)European UnionFaroe IslandsFijiFinlandFragile and conflict affected situationsFranceFrench PolynesiaGabonGambia, TheGeorgiaGermanyGhanaGreeceGrenadaGuatemalaGuineaGuinea-BissauGuyanaHaitiHeavily indebted poor countries (HIPC)High incomeHondurasHong Kong SAR, ChinaHungaryIBRD onlyIcelandIDA & IBRD totalIDA blendIDA onlyIDA totalIndiaIndonesiaIran, Islamic Rep.IraqIrelandIsraelItalyJamaicaJapanJordanKazakhstanKenyaKiribatiKorea, Rep.KosovoKuwaitKyrgyz RepublicLao PDRLate-demographic dividendLatin America & Caribbean Latin America & Caribbean (excluding high income)Latin America & the Caribbean (IDA & IBRD countries)LatviaLeast developed countries: UN classificationLebanonLesothoLiberiaLibyaLithuaniaLow & middle incomeLow incomeLower middle incomeLuxembourgMacao SAR, ChinaMacedonia, FYRMadagascarMalawiMalaysiaMaldivesMaliMaltaMarshall IslandsMauritaniaMauritiusMexicoMicronesia, Fed. Sts.Middle East & North Africa (excluding high income)Middle East & North Africa (IDA & IBRD countries)Middle incomeMoldovaMongoliaMontenegroMoroccoMozambiqueMyanmarNamibiaNepalNetherlandsNew CaledoniaNew ZealandNicaraguaNigerNigeriaNorth AmericaNorwayOECD membersOmanPacific island small statesPakistanPalauPanamaPapua New GuineaParaguayPeruPhilippinesPolandPortugalPost-demographic dividendPre-demographic dividendQatarRomaniaRussian FederationRwandaSamoaSao Tome and PrincipeSaudi ArabiaSenegalSerbiaSeychellesSierra LeoneSingaporeSint Maarten (Dutch part)Slovak RepublicSloveniaSolomon IslandsSouth AfricaSouth AsiaSouth Asia (IDA & IBRD)South SudanSpainSri LankaSt. Kitts and NevisSt. LuciaSt. Vincent and the GrenadinesSub-Saharan Africa Sub-Saharan Africa (excluding high income)Sub-Saharan Africa (IDA & IBRD countries)SudanSurinameSwazilandSwedenSwitzerlandSyrian Arab RepublicTajikistanTanzaniaThailandTimor-LesteTogoTongaTrinidad and TobagoTunisiaTurkeyTuvaluUgandaUkraineUnited KingdomUnited StatesUpper middle incomeUruguayVanuatuVenezuela, RBVietnamWest Bank and GazaWorldYemen, Rep.ZambiaZimbabwe línea de tiempo (timeline):
En esta escala de tiempo se presenta un gráfico de 1983 y 2016 de Upper middle income. Los datos de 1982 están ausentes. El número de observaciones reales por fecha: 34.
Fuente (nombre):
Indicadores del desarrollo mundial
Fuente (organización):
International Monetary Fund, Balance of Payments Statistics Yearbook and data files.
Categorías:
Private Sector, Trade
Se ha actualizado:
23 abr 2017 año
Los indicadores de los cambios de valor en los últimos años
Mínimo:
32.966 bn
1 ene 1984 año
Máximo:
756.206 bn
1 ene 2015 año
A la fecha de observación
Valor
Cambio absoluto
El cambio con respecto al valor anterior
1 ene 1983 año
33.253 bn
+33.253 bn
0.0%
1 ene 1984 año
32.966 bn
-287.184 millones
-0.86%
1 ene 1985 año
35.1 bn
+2.134 bn
6.47%
1 ene 1986 año
35.834 bn
+733.767 millones
2.09%
1 ene 1987 año
37.128 bn
+1.294 bn
3.61%
1 ene 1988 año
43.406 bn
+6.278 bn
16.91%
1 ene 1989 año
51.243 bn
+7.837 bn
18.05%
1 ene 1990 año
57.701 bn
+6.458 bn
12.6%
1 ene 1991 año
67.412 bn
+9.712 bn
16.83%
1 ene 1992 año
71.231 bn
+3.819 bn
5.66%
1 ene 1993 año
83.355 bn
+12.124 bn
17.02%
1 ene 1994 año
95.018 bn
+11.663 bn
13.99%
1 ene 1995 año
110.42 bn
+15.402 bn
16.21%
1 ene 1996 año
128.376 bn
+17.956 bn
16.26%
1 ene 1997 año
142.236 bn
+13.86 bn
10.8%
1 ene 1998 año
194.955 bn
+52.719 bn
37.06%
1 ene 1999 año
191.09 bn
-3.866 bn
-1.98%
1 ene 2000 año
188.622 bn
-2.467 bn
-1.29%
1 ene 2001 año
211.94 bn
+23.318 bn
12.36%
1 ene 2002 año
219.342 bn
+7.402 bn
3.49%
1 ene 2003 año
237.448 bn
+18.106 bn
8.25%
1 ene 2004 año
213.388 bn
-24.06 bn
-10.13%
1 ene 2005 año
266.33 bn
+52.942 bn
24.81%
1 ene 2006 año
300.413 bn
+34.083 bn
12.8%
1 ene 2007 año
346.616 bn
+46.203 bn
15.38%
1 ene 2008 año
429.582 bn
+82.967 bn
23.94%
1 ene 2009 año
502.976 bn
+73.393 bn
17.08%
1 ene 2010 año
443.427 bn
-59.549 bn
-11.84%
1 ene 2011 año
465.969 bn
+22.542 bn
5.08%
1 ene 2012 año
603.096 bn
+137.127 bn
29.43%
1 ene 2013 año
627.23 bn
+24.134 bn
4.0%
1 ene 2014 año
670.998 bn
+43.768 bn
6.98%
1 ene 2015 año
756.206 bn
+85.208 bn
12.7%
1 ene 2016 año
732.125 bn
-24.081 bn
-3.18%
Ranking de los países por los datos estadísticos actuales


Comentarios: