29
/es/
es
AIzaSyAYiBZKx7MnpbEhh9jyipgxe19OcubqV5w
April 1, 2024
27944
East Asia & Pacific (excluding high income)
EAP
false
2
1
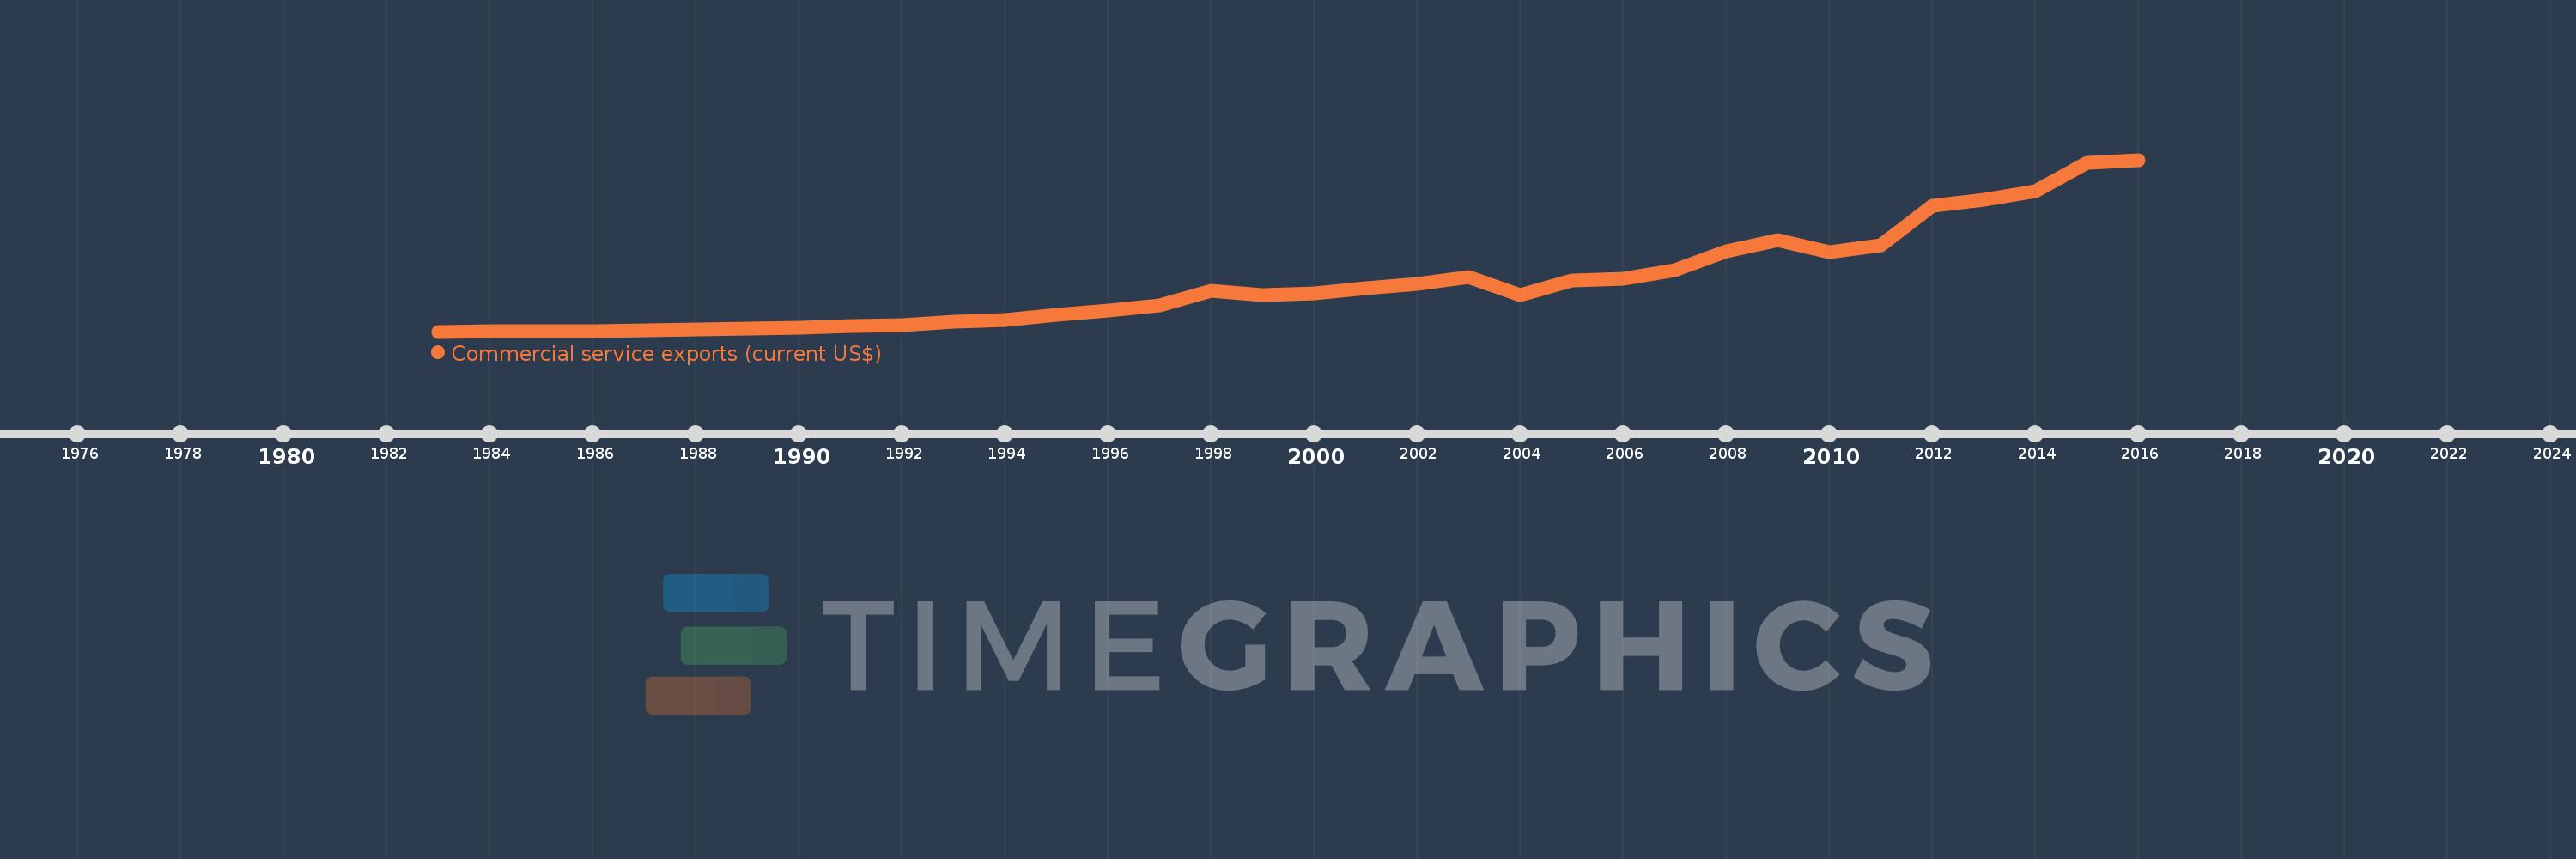
Commercial service exports (current US$)
2016,2015,2014,2013,2012,2011,2010,2009,2008,2007,2006,2005,2004,2003,2002,2001,2000,1999,1998,1997,1996,1995,1994,1993,1992,1991,1990,1989,1988,1987,1986,1985,1984,1983
Estas estadísticas en otros países:
AfghanistanAlbaniaAlgeriaAngolaAntigua and BarbudaArab WorldArgentinaArmeniaArubaAustraliaAustriaAzerbaijanBahamas, TheBahrainBangladeshBarbadosBelarusBelgiumBelizeBeninBermudaBhutanBoliviaBosnia and HerzegovinaBotswanaBrazilBrunei DarussalamBulgariaBurkina FasoBurundiCabo VerdeCambodiaCameroonCanadaCaribbean small statesCentral African RepublicCentral Europe and the BalticsChadChileChinaColombiaComorosCongo, Dem. Rep.Congo, Rep.Costa RicaCote d'IvoireCroatiaCuracaoCyprusCzech RepublicDenmarkDjiboutiDominicaDominican RepublicEarly-demographic dividendEast Asia & PacificEast Asia & Pacific (excluding high income)East Asia & Pacific (IDA & IBRD countries)EcuadorEgypt, Arab Rep.El SalvadorEquatorial GuineaEritreaEstoniaEthiopiaEuro areaEurope & Central AsiaEurope & Central Asia (excluding high income)Europe & Central Asia (IDA & IBRD countries)European UnionFaroe IslandsFijiFinlandFragile and conflict affected situationsFranceFrench PolynesiaGabonGambia, TheGeorgiaGermanyGhanaGreeceGrenadaGuatemalaGuineaGuinea-BissauGuyanaHaitiHeavily indebted poor countries (HIPC)High incomeHondurasHong Kong SAR, ChinaHungaryIBRD onlyIcelandIDA & IBRD totalIDA blendIDA onlyIDA totalIndiaIndonesiaIran, Islamic Rep.IraqIrelandIsraelItalyJamaicaJapanJordanKazakhstanKenyaKiribatiKorea, Rep.KosovoKuwaitKyrgyz RepublicLao PDRLate-demographic dividendLatin America & Caribbean Latin America & Caribbean (excluding high income)Latin America & the Caribbean (IDA & IBRD countries)LatviaLeast developed countries: UN classificationLebanonLesothoLiberiaLibyaLithuaniaLow & middle incomeLow incomeLower middle incomeLuxembourgMacao SAR, ChinaMacedonia, FYRMadagascarMalawiMalaysiaMaldivesMaliMaltaMarshall IslandsMauritaniaMauritiusMexicoMicronesia, Fed. Sts.Middle East & North Africa (excluding high income)Middle East & North Africa (IDA & IBRD countries)Middle incomeMoldovaMongoliaMontenegroMoroccoMozambiqueMyanmarNamibiaNepalNetherlandsNew CaledoniaNew ZealandNicaraguaNigerNigeriaNorth AmericaNorwayOECD membersOmanPacific island small statesPakistanPalauPanamaPapua New GuineaParaguayPeruPhilippinesPolandPortugalPost-demographic dividendPre-demographic dividendQatarRomaniaRussian FederationRwandaSamoaSao Tome and PrincipeSaudi ArabiaSenegalSerbiaSeychellesSierra LeoneSingaporeSint Maarten (Dutch part)Slovak RepublicSloveniaSolomon IslandsSouth AfricaSouth AsiaSouth Asia (IDA & IBRD)South SudanSpainSri LankaSt. Kitts and NevisSt. LuciaSt. Vincent and the GrenadinesSub-Saharan Africa Sub-Saharan Africa (excluding high income)Sub-Saharan Africa (IDA & IBRD countries)SudanSurinameSwazilandSwedenSwitzerlandSyrian Arab RepublicTajikistanTanzaniaThailandTimor-LesteTogoTongaTrinidad and TobagoTunisiaTurkeyTuvaluUgandaUkraineUnited KingdomUnited StatesUpper middle incomeUruguayVanuatuVenezuela, RBVietnamWest Bank and GazaWorldYemen, Rep.ZambiaZimbabwe línea de tiempo (timeline):
En esta escala de tiempo se presenta un gráfico de 1983 y 2016 de East Asia & Pacific (excluding high income). Los datos de 1982 están ausentes. El número de observaciones reales por fecha: 34.
Fuente (nombre):
Indicadores del desarrollo mundial
Fuente (organización):
International Monetary Fund, Balance of Payments Statistics Yearbook and data files.
Categorías:
Private Sector, Trade
Se ha actualizado:
23 abr 2017 año
Los indicadores de los cambios de valor en los últimos años
Mínimo:
8.354 bn
1 ene 1983 año
Máximo:
455.399 bn
1 ene 2016 año
A la fecha de observación
Valor
Cambio absoluto
El cambio con respecto al valor anterior
1 ene 1983 año
8.354 bn
+8.354 bn
0.0%
1 ene 1984 año
8.759 bn
+405.698 millones
4.86%
1 ene 1985 año
9.166 bn
+406.647 millones
4.64%
1 ene 1986 año
10.188 bn
+1.022 bn
11.15%
1 ene 1987 año
11.561 bn
+1.373 bn
13.48%
1 ene 1988 año
13.206 bn
+1.645 bn
14.23%
1 ene 1989 año
15.982 bn
+2.776 bn
21.02%
1 ene 1990 año
18.393 bn
+2.41 bn
15.08%
1 ene 1991 año
22.799 bn
+4.406 bn
23.96%
1 ene 1992 año
26.164 bn
+3.365 bn
14.76%
1 ene 1993 año
33.221 bn
+7.057 bn
26.97%
1 ene 1994 año
39.191 bn
+5.97 bn
17.97%
1 ene 1995 año
51.347 bn
+12.156 bn
31.02%
1 ene 1996 año
62.79 bn
+11.443 bn
22.29%
1 ene 1997 año
75.941 bn
+13.151 bn
20.94%
1 ene 1998 año
115.547 bn
+39.606 bn
52.15%
1 ene 1999 año
103.653 bn
-11.894 bn
-10.29%
1 ene 2000 año
107.119 bn
+3.466 bn
3.34%
1 ene 2001 año
122.21 bn
+15.091 bn
14.09%
1 ene 2002 año
132.564 bn
+10.354 bn
8.47%
1 ene 2003 año
149.484 bn
+16.92 bn
12.76%
1 ene 2004 año
103.006 bn
-46.478 bn
-31.09%
1 ene 2005 año
140.963 bn
+37.957 bn
36.85%
1 ene 2006 año
146.571 bn
+5.608 bn
3.98%
1 ene 2007 año
167.871 bn
+21.3 bn
14.53%
1 ene 2008 año
218.449 bn
+50.579 bn
30.13%
1 ene 2009 año
246.638 bn
+28.188 bn
12.9%
1 ene 2010 año
215.884 bn
-30.754 bn
-12.47%
1 ene 2011 año
232.068 bn
+16.184 bn
7.5%
1 ene 2012 año
336.42 bn
+104.352 bn
44.97%
1 ene 2013 año
351.886 bn
+15.466 bn
4.6%
1 ene 2014 año
372.937 bn
+21.05 bn
5.98%
1 ene 2015 año
446.994 bn
+74.057 bn
19.86%
1 ene 2016 año
455.399 bn
+8.405 bn
1.88%
Ranking de los países por los datos estadísticos actuales


Comentarios: