29
/es/
es
AIzaSyAYiBZKx7MnpbEhh9jyipgxe19OcubqV5w
April 1, 2024
52478
OECD members
OED
false
2
1
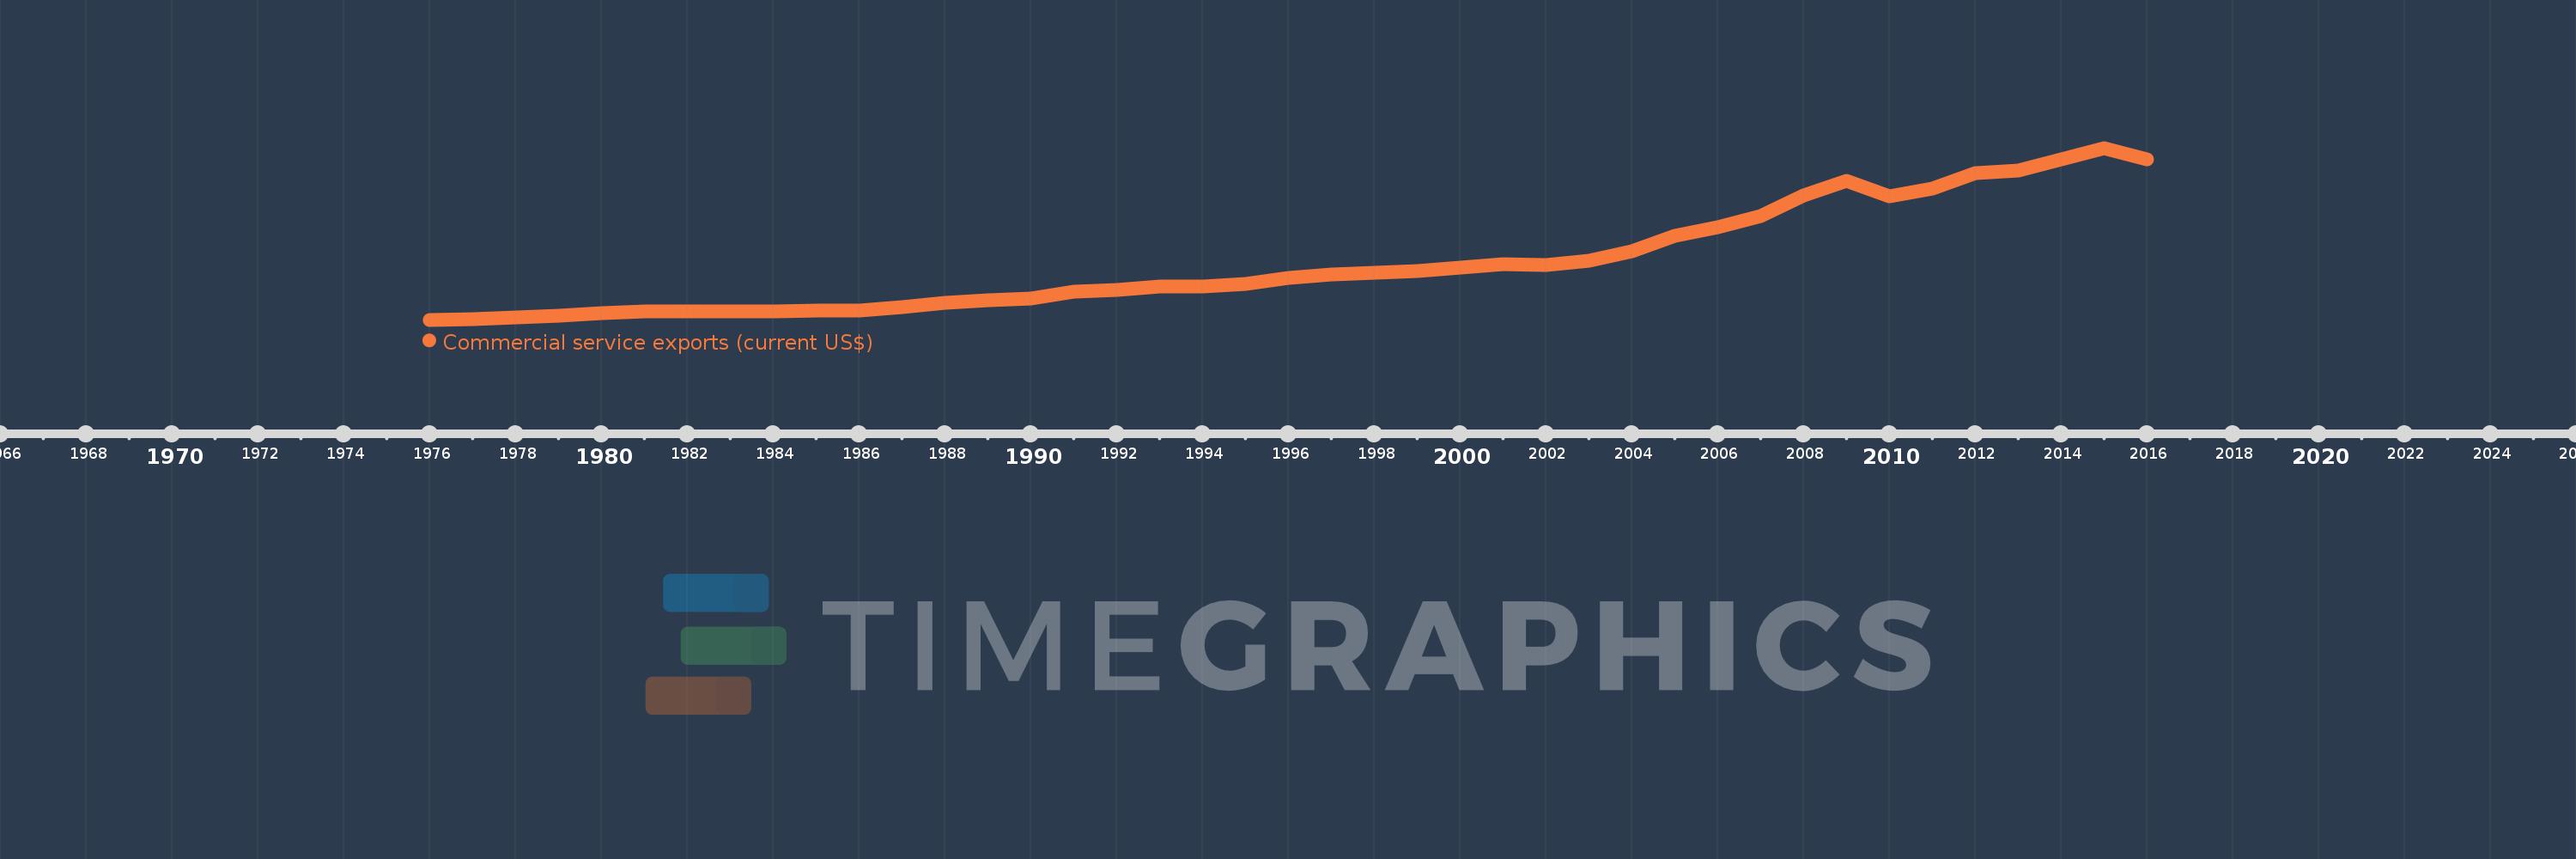
Commercial service exports (current US$)
2016,2015,2014,2013,2012,2011,2010,2009,2008,2007,2006,2005,2004,2003,2002,2001,2000,1999,1998,1997,1996,1995,1994,1993,1992,1991,1990,1989,1988,1987,1986,1985,1984,1983,1982,1981,1980,1979,1978,1977,1976
Estas estadísticas en otros países:
AfghanistanAlbaniaAlgeriaAngolaAntigua and BarbudaArab WorldArgentinaArmeniaArubaAustraliaAustriaAzerbaijanBahamas, TheBahrainBangladeshBarbadosBelarusBelgiumBelizeBeninBermudaBhutanBoliviaBosnia and HerzegovinaBotswanaBrazilBrunei DarussalamBulgariaBurkina FasoBurundiCabo VerdeCambodiaCameroonCanadaCaribbean small statesCentral African RepublicCentral Europe and the BalticsChadChileChinaColombiaComorosCongo, Dem. Rep.Congo, Rep.Costa RicaCote d'IvoireCroatiaCuracaoCyprusCzech RepublicDenmarkDjiboutiDominicaDominican RepublicEarly-demographic dividendEast Asia & PacificEast Asia & Pacific (excluding high income)East Asia & Pacific (IDA & IBRD countries)EcuadorEgypt, Arab Rep.El SalvadorEquatorial GuineaEritreaEstoniaEthiopiaEuro areaEurope & Central AsiaEurope & Central Asia (excluding high income)Europe & Central Asia (IDA & IBRD countries)European UnionFaroe IslandsFijiFinlandFragile and conflict affected situationsFranceFrench PolynesiaGabonGambia, TheGeorgiaGermanyGhanaGreeceGrenadaGuatemalaGuineaGuinea-BissauGuyanaHaitiHeavily indebted poor countries (HIPC)High incomeHondurasHong Kong SAR, ChinaHungaryIBRD onlyIcelandIDA & IBRD totalIDA blendIDA onlyIDA totalIndiaIndonesiaIran, Islamic Rep.IraqIrelandIsraelItalyJamaicaJapanJordanKazakhstanKenyaKiribatiKorea, Rep.KosovoKuwaitKyrgyz RepublicLao PDRLate-demographic dividendLatin America & Caribbean Latin America & Caribbean (excluding high income)Latin America & the Caribbean (IDA & IBRD countries)LatviaLeast developed countries: UN classificationLebanonLesothoLiberiaLibyaLithuaniaLow & middle incomeLow incomeLower middle incomeLuxembourgMacao SAR, ChinaMacedonia, FYRMadagascarMalawiMalaysiaMaldivesMaliMaltaMarshall IslandsMauritaniaMauritiusMexicoMicronesia, Fed. Sts.Middle East & North Africa (excluding high income)Middle East & North Africa (IDA & IBRD countries)Middle incomeMoldovaMongoliaMontenegroMoroccoMozambiqueMyanmarNamibiaNepalNetherlandsNew CaledoniaNew ZealandNicaraguaNigerNigeriaNorth AmericaNorwayOECD membersOmanPacific island small statesPakistanPalauPanamaPapua New GuineaParaguayPeruPhilippinesPolandPortugalPost-demographic dividendPre-demographic dividendQatarRomaniaRussian FederationRwandaSamoaSao Tome and PrincipeSaudi ArabiaSenegalSerbiaSeychellesSierra LeoneSingaporeSint Maarten (Dutch part)Slovak RepublicSloveniaSolomon IslandsSouth AfricaSouth AsiaSouth Asia (IDA & IBRD)South SudanSpainSri LankaSt. Kitts and NevisSt. LuciaSt. Vincent and the GrenadinesSub-Saharan Africa Sub-Saharan Africa (excluding high income)Sub-Saharan Africa (IDA & IBRD countries)SudanSurinameSwazilandSwedenSwitzerlandSyrian Arab RepublicTajikistanTanzaniaThailandTimor-LesteTogoTongaTrinidad and TobagoTunisiaTurkeyTuvaluUgandaUkraineUnited KingdomUnited StatesUpper middle incomeUruguayVanuatuVenezuela, RBVietnamWest Bank and GazaWorldYemen, Rep.ZambiaZimbabwe línea de tiempo (timeline):
En esta escala de tiempo se presenta un gráfico de 1976 y 2016 de OECD members. Los datos de 1975 están ausentes. El número de observaciones reales por fecha: 41.
Fuente (nombre):
Indicadores del desarrollo mundial
Fuente (organización):
International Monetary Fund, Balance of Payments Statistics Yearbook and data files.
Categorías:
Private Sector, Trade
Se ha actualizado:
23 abr 2017 año
Los indicadores de los cambios de valor en los últimos años
En promedio:
1.278 billones
Mínimo:
136.618 bn
1 ene 1976 año
Máximo:
3.554 billones
1 ene 2015 año
A la fecha de observación
Valor
Cambio absoluto
El cambio con respecto al valor anterior
1 ene 1976 año
136.618 bn
+136.618 bn
0.0%
1 ene 1977 año
152.016 bn
+15.397 bn
11.27%
1 ene 1978 año
175.568 bn
+23.552 bn
15.49%
1 ene 1979 año
215.004 bn
+39.437 bn
22.46%
1 ene 1980 año
260.569 bn
+45.565 bn
21.19%
1 ene 1981 año
308.586 bn
+48.017 bn
18.43%
1 ene 1982 año
309.022 bn
+436.076 millones
0.14%
1 ene 1983 año
307.731 bn
-1.291 bn
-0.42%
1 ene 1984 año
300.201 bn
-7.53 bn
-2.45%
1 ene 1985 año
311.349 bn
+11.149 bn
3.71%
1 ene 1986 año
327.313 bn
+15.963 bn
5.13%
1 ene 1987 año
393.768 bn
+66.455 bn
20.3%
1 ene 1988 año
467.408 bn
+73.64 bn
18.7%
1 ene 1989 año
518.97 bn
+51.562 bn
11.03%
1 ene 1990 año
561.194 bn
+42.224 bn
8.14%
1 ene 1991 año
687.435 bn
+126.241 bn
22.5%
1 ene 1992 año
721.53 bn
+34.095 bn
4.96%
1 ene 1993 año
805.858 bn
+84.328 bn
11.69%
1 ene 1994 año
795.61 bn
-10.248 bn
-1.27%
1 ene 1995 año
856.996 bn
+61.387 bn
7.72%
1 ene 1996 año
973.479 bn
+116.483 bn
13.59%
1 ene 1997 año
1.033 billones
+59.46 bn
6.11%
1 ene 1998 año
1.073 billones
+40.183 bn
3.89%
1 ene 1999 año
1.109 billones
+35.455 bn
3.3%
1 ene 2000 año
1.173 billones
+63.972 bn
5.77%
1 ene 2001 año
1.242 billones
+69.296 bn
5.91%
1 ene 2002 año
1.226 billones
-15.733 bn
-1.27%
1 ene 2003 año
1.307 billones
+80.73 bn
6.58%
1 ene 2004 año
1.494 billones
+186.95 bn
14.31%
1 ene 2005 año
1.8 billones
+306.65 bn
20.53%
1 ene 2006 año
1.973 billones
+172.35 bn
9.57%
1 ene 2007 año
2.197 billones
+224.066 bn
11.36%
1 ene 2008 año
2.605 billones
+407.945 bn
18.57%
1 ene 2009 año
2.907 billones
+302.334 bn
11.61%
1 ene 2010 año
2.585 billones
-322.258 bn
-11.09%
1 ene 2011 año
2.738 billones
+153.426 bn
5.94%
1 ene 2012 año
3.061 billones
+322.684 bn
11.78%
1 ene 2013 año
3.105 billones
+43.717 bn
1.43%
1 ene 2014 año
3.319 billones
+213.928 bn
6.89%
1 ene 2015 año
3.554 billones
+235.092 bn
7.08%
1 ene 2016 año
3.326 billones
-227.348 bn
-6.4%
Ranking de los países por los datos estadísticos actuales


Comentarios: