29
/es/
es
AIzaSyAYiBZKx7MnpbEhh9jyipgxe19OcubqV5w
April 1, 2024
69739
Argentina
ARG
true
2
1
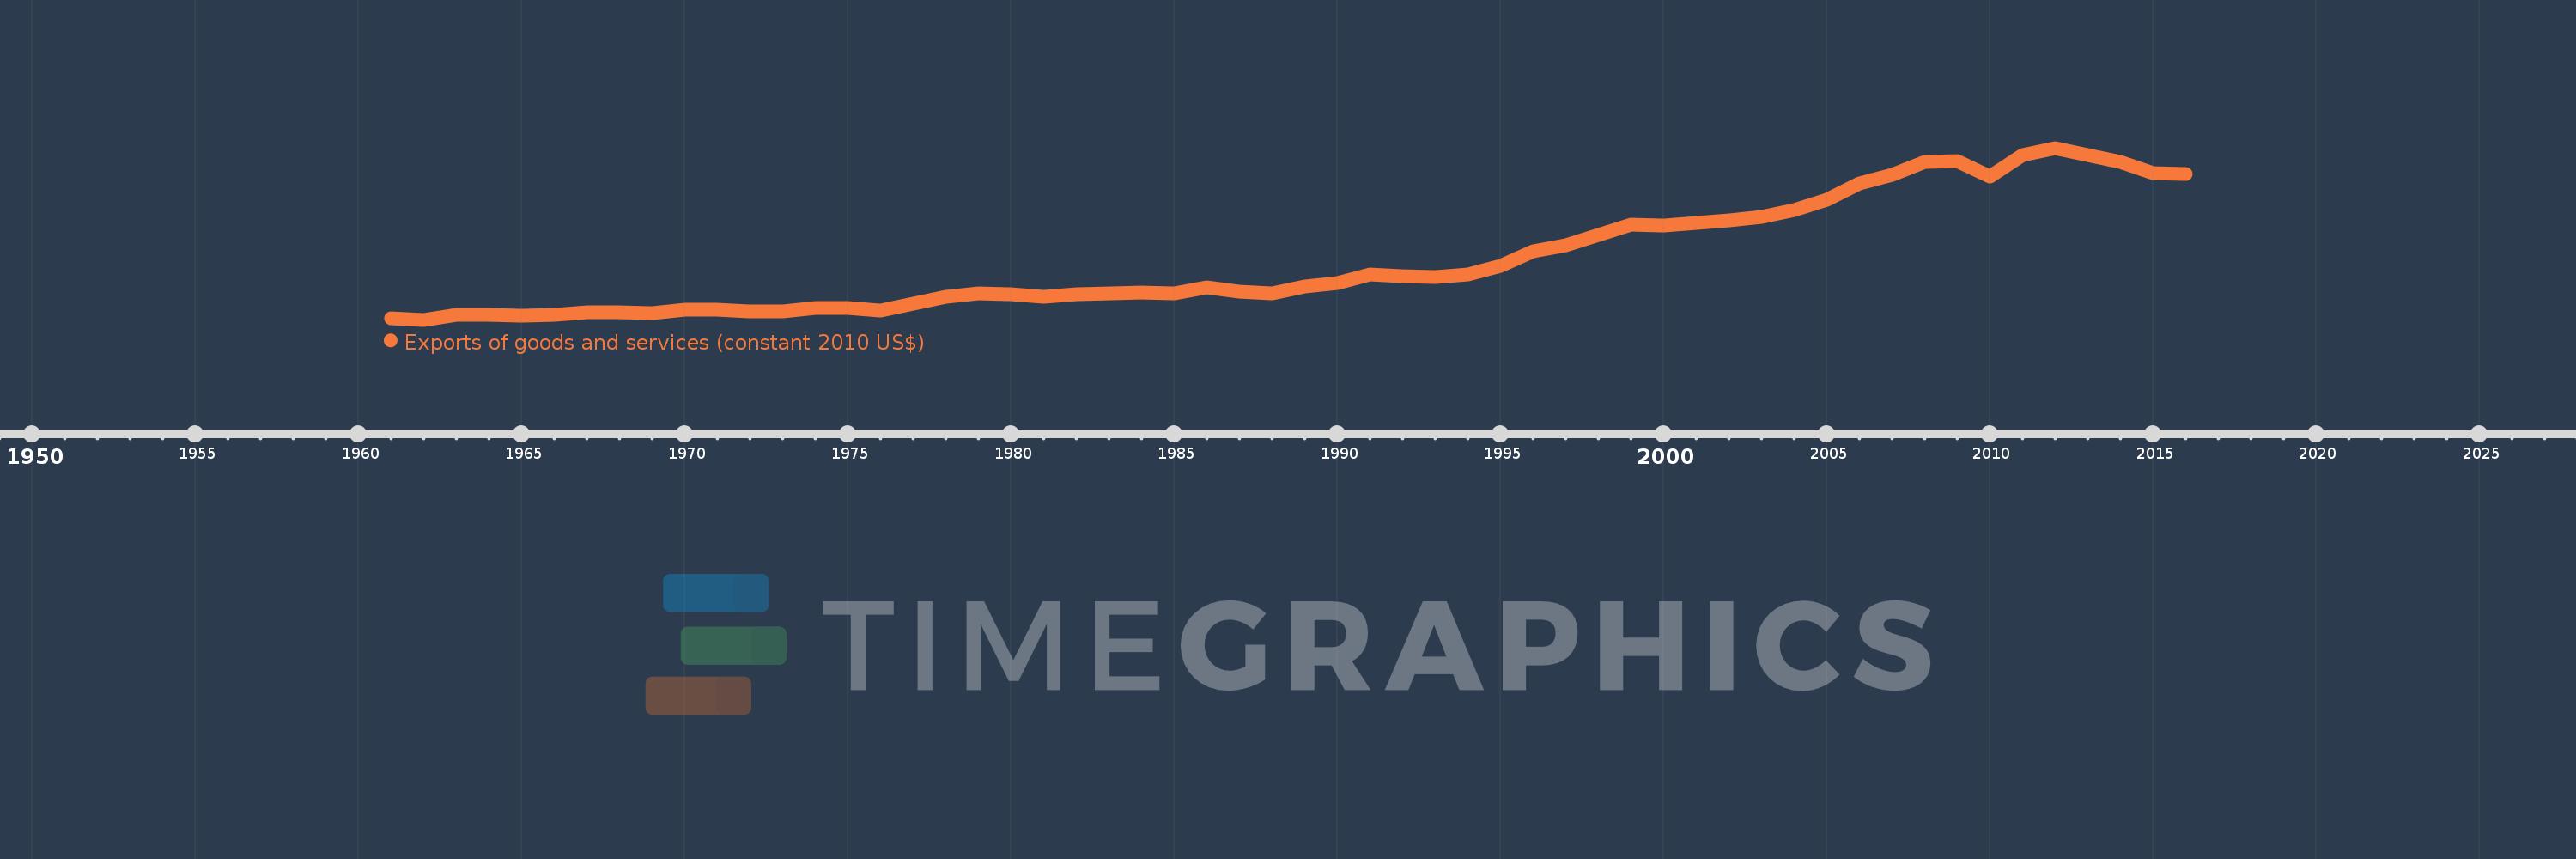
Exports of goods and services (constant 2010 US$)
2016,2015,2014,2013,2012,2011,2010,2009,2008,2007,2006,2005,2004,2003,2002,2001,2000,1999,1998,1997,1996,1995,1994,1993,1992,1991,1990,1989,1988,1987,1986,1985,1984,1983,1982,1981,1980,1979,1978,1977,1976,1975,1974,1973,1972,1971,1970,1969,1968,1967,1966,1965,1964,1963,1962,1961
Estas estadísticas en otros países:
AfghanistanAlbaniaAlgeriaAngolaAntigua and BarbudaArab WorldArgentinaArmeniaArubaAustraliaAustriaAzerbaijanBahamas, TheBahrainBangladeshBarbadosBelarusBelgiumBelizeBeninBermudaBhutanBoliviaBosnia and HerzegovinaBotswanaBrazilBrunei DarussalamBulgariaBurkina FasoBurundiCabo VerdeCambodiaCameroonCanadaCaribbean small statesCentral African RepublicCentral Europe and the BalticsChadChileChinaColombiaComorosCongo, Dem. Rep.Congo, Rep.Costa RicaCote d'IvoireCroatiaCubaCyprusCzech RepublicDenmarkDominicaDominican RepublicEarly-demographic dividendEast Asia & PacificEast Asia & Pacific (excluding high income)East Asia & Pacific (IDA & IBRD countries)EcuadorEgypt, Arab Rep.El SalvadorEquatorial GuineaEritreaEstoniaEuro areaEurope & Central AsiaEurope & Central Asia (excluding high income)Europe & Central Asia (IDA & IBRD countries)European UnionFaroe IslandsFijiFinlandFragile and conflict affected situationsFranceGabonGambia, TheGeorgiaGermanyGhanaGreeceGrenadaGuatemalaGuineaGuinea-BissauGuyanaHaitiHeavily indebted poor countries (HIPC)High incomeHondurasHong Kong SAR, ChinaHungaryIBRD onlyIcelandIDA & IBRD totalIDA blendIDA onlyIDA totalIndiaIndonesiaIran, Islamic Rep.IraqIrelandIsraelItalyJamaicaJapanJordanKazakhstanKenyaKiribatiKorea, Rep.KosovoKuwaitKyrgyz RepublicLao PDRLate-demographic dividendLatin America & Caribbean Latin America & Caribbean (excluding high income)Latin America & the Caribbean (IDA & IBRD countries)LatviaLeast developed countries: UN classificationLebanonLiberiaLibyaLithuaniaLow & middle incomeLow incomeLower middle incomeLuxembourgMacao SAR, ChinaMacedonia, FYRMadagascarMalawiMalaysiaMaldivesMaliMaltaMauritaniaMauritiusMexicoMiddle East & North AfricaMiddle East & North Africa (excluding high income)Middle East & North Africa (IDA & IBRD countries)Middle incomeMoldovaMongoliaMontenegroMoroccoMozambiqueMyanmarNamibiaNepalNetherlandsNew ZealandNicaraguaNigerNigeriaNorth AmericaNorwayOECD membersOmanOther small statesPacific island small statesPakistanPalauPanamaParaguayPeruPhilippinesPolandPortugalPost-demographic dividendPre-demographic dividendPuerto RicoQatarRomaniaRussian FederationRwandaSamoaSaudi ArabiaSenegalSerbiaSeychellesSierra LeoneSingaporeSlovak RepublicSloveniaSmall statesSolomon IslandsSouth AfricaSouth AsiaSouth Asia (IDA & IBRD)South SudanSpainSri LankaSt. Kitts and NevisSt. LuciaSt. Vincent and the GrenadinesSub-Saharan Africa Sub-Saharan Africa (excluding high income)Sub-Saharan Africa (IDA & IBRD countries)SudanSurinameSwazilandSwedenSwitzerlandTajikistanTanzaniaThailandTimor-LesteTogoTongaTrinidad and TobagoTunisiaTurkeyTurkmenistanUgandaUkraineUnited Arab EmiratesUnited KingdomUnited StatesUpper middle incomeUruguayUzbekistanVanuatuVenezuela, RBVietnamWest Bank and GazaWorldYemen, Rep.ZambiaZimbabwe línea de tiempo (timeline):
En esta escala de tiempo se presenta un gráfico de 1961 y 2016 de Argentina. Los datos de 1960 están ausentes. El número de observaciones reales por fecha: 56.
Fuente (nombre):
Indicadores del desarrollo mundial
Fuente (organización):
World Bank national accounts data, and OECD National Accounts data files.
Categorías:
Economy & Growth, Trade
Se ha actualizado:
23 abr 2017 año
Los indicadores de los cambios de valor en los últimos años
Mínimo:
5.133 bn
1 ene 1962 año
Máximo:
83.537 bn
1 ene 2012 año
A la fecha de observación
Valor
Cambio absoluto
El cambio con respecto al valor anterior
1 ene 1961 año
5.744 bn
+5.744 bn
0.0%
1 ene 1962 año
5.133 bn
-611.057 millones
-10.64%
1 ene 1963 año
7.455 bn
+2.322 bn
45.24%
1 ene 1964 año
7.455 bn
0.0
0.0%
1 ene 1965 año
6.844 bn
-611.035 millones
-8.2%
1 ene 1966 año
7.455 bn
+611.035 millones
8.93%
1 ene 1967 año
8.677 bn
+1.222 bn
16.39%
1 ene 1968 año
8.677 bn
0.0
0.0%
1 ene 1969 año
8.066 bn
-611.031 millones
-7.04%
1 ene 1970 año
9.777 bn
+1.711 bn
21.21%
1 ene 1971 año
9.894 bn
+117.33 millones
1.2%
1 ene 1972 año
8.911 bn
-982.564 millones
-9.93%
1 ene 1973 año
9.092 bn
+180.865 millones
2.03%
1 ene 1974 año
10.363 bn
+1.271 bn
13.98%
1 ene 1975 año
10.388 bn
+24.43 millones
0.24%
1 ene 1976 año
9.422 bn
-965.446 millones
-9.29%
1 ene 1977 año
12.392 bn
+2.97 bn
31.52%
1 ene 1978 año
15.777 bn
+3.385 bn
27.32%
1 ene 1979 año
17.182 bn
+1.405 bn
8.91%
1 ene 1980 año
16.632 bn
-549.922 millones
-3.2%
1 ene 1981 año
15.777 bn
-855.384 millones
-5.14%
1 ene 1982 año
16.598 bn
+821.024 millones
5.2%
1 ene 1983 año
17.253 bn
+655.052 millones
3.95%
1 ene 1984 año
17.699 bn
+445.581 millones
2.58%
1 ene 1985 año
17.24 bn
-458.662 millones
-2.59%
1 ene 1986 año
19.922 bn
+2.682 bn
15.55%
1 ene 1987 año
17.876 bn
-2.046 bn
-10.27%
1 ene 1988 año
17.253 bn
-622.427 millones
-3.48%
1 ene 1989 año
20.483 bn
+3.23 bn
18.72%
1 ene 1990 año
22.005 bn
+1.522 bn
7.43%
1 ene 1991 año
25.968 bn
+3.963 bn
18.01%
1 ene 1992 año
25.027 bn
-941.126 millones
-3.62%
1 ene 1993 año
24.769 bn
-257.703 millones
-1.03%
1 ene 1994 año
25.756 bn
+986.614 millones
3.98%
1 ene 1995 año
29.696 bn
+3.94 bn
15.3%
1 ene 1996 año
36.385 bn
+6.69 bn
22.53%
1 ene 1997 año
39.168 bn
+2.782 bn
7.65%
1 ene 1998 año
43.937 bn
+4.77 bn
12.18%
1 ene 1999 año
48.605 bn
+4.668 bn
10.62%
1 ene 2000 año
47.992 bn
-612.558 millones
-1.26%
1 ene 2001 año
49.289 bn
+1.297 bn
2.7%
1 ene 2002 año
50.64 bn
+1.351 bn
2.74%
1 ene 2003 año
52.207 bn
+1.566 bn
3.09%
1 ene 2004 año
55.337 bn
+3.13 bn
6.0%
1 ene 2005 año
59.827 bn
+4.49 bn
8.11%
1 ene 2006 año
67.536 bn
+7.71 bn
12.89%
1 ene 2007 año
71.292 bn
+3.756 bn
5.56%
1 ene 2008 año
77.113 bn
+5.821 bn
8.16%
1 ene 2009 año
77.683 bn
+570.539 millones
0.74%
1 ene 2010 año
70.422 bn
-7.261 bn
-9.35%
1 ene 2011 año
80.209 bn
+9.787 bn
13.9%
1 ene 2012 año
83.537 bn
+3.328 bn
4.15%
1 ene 2013 año
80.105 bn
-3.432 bn
-4.11%
1 ene 2014 año
77.285 bn
-2.82 bn
-3.52%
1 ene 2015 año
71.891 bn
-5.394 bn
-6.98%
1 ene 2016 año
71.569 bn
-321.723 millones
-0.45%
Ranking de los países por los datos estadísticos actuales


Comentarios: