29
/es/
es
AIzaSyAYiBZKx7MnpbEhh9jyipgxe19OcubqV5w
April 1, 2024
134055
France
FRA
true
2
1
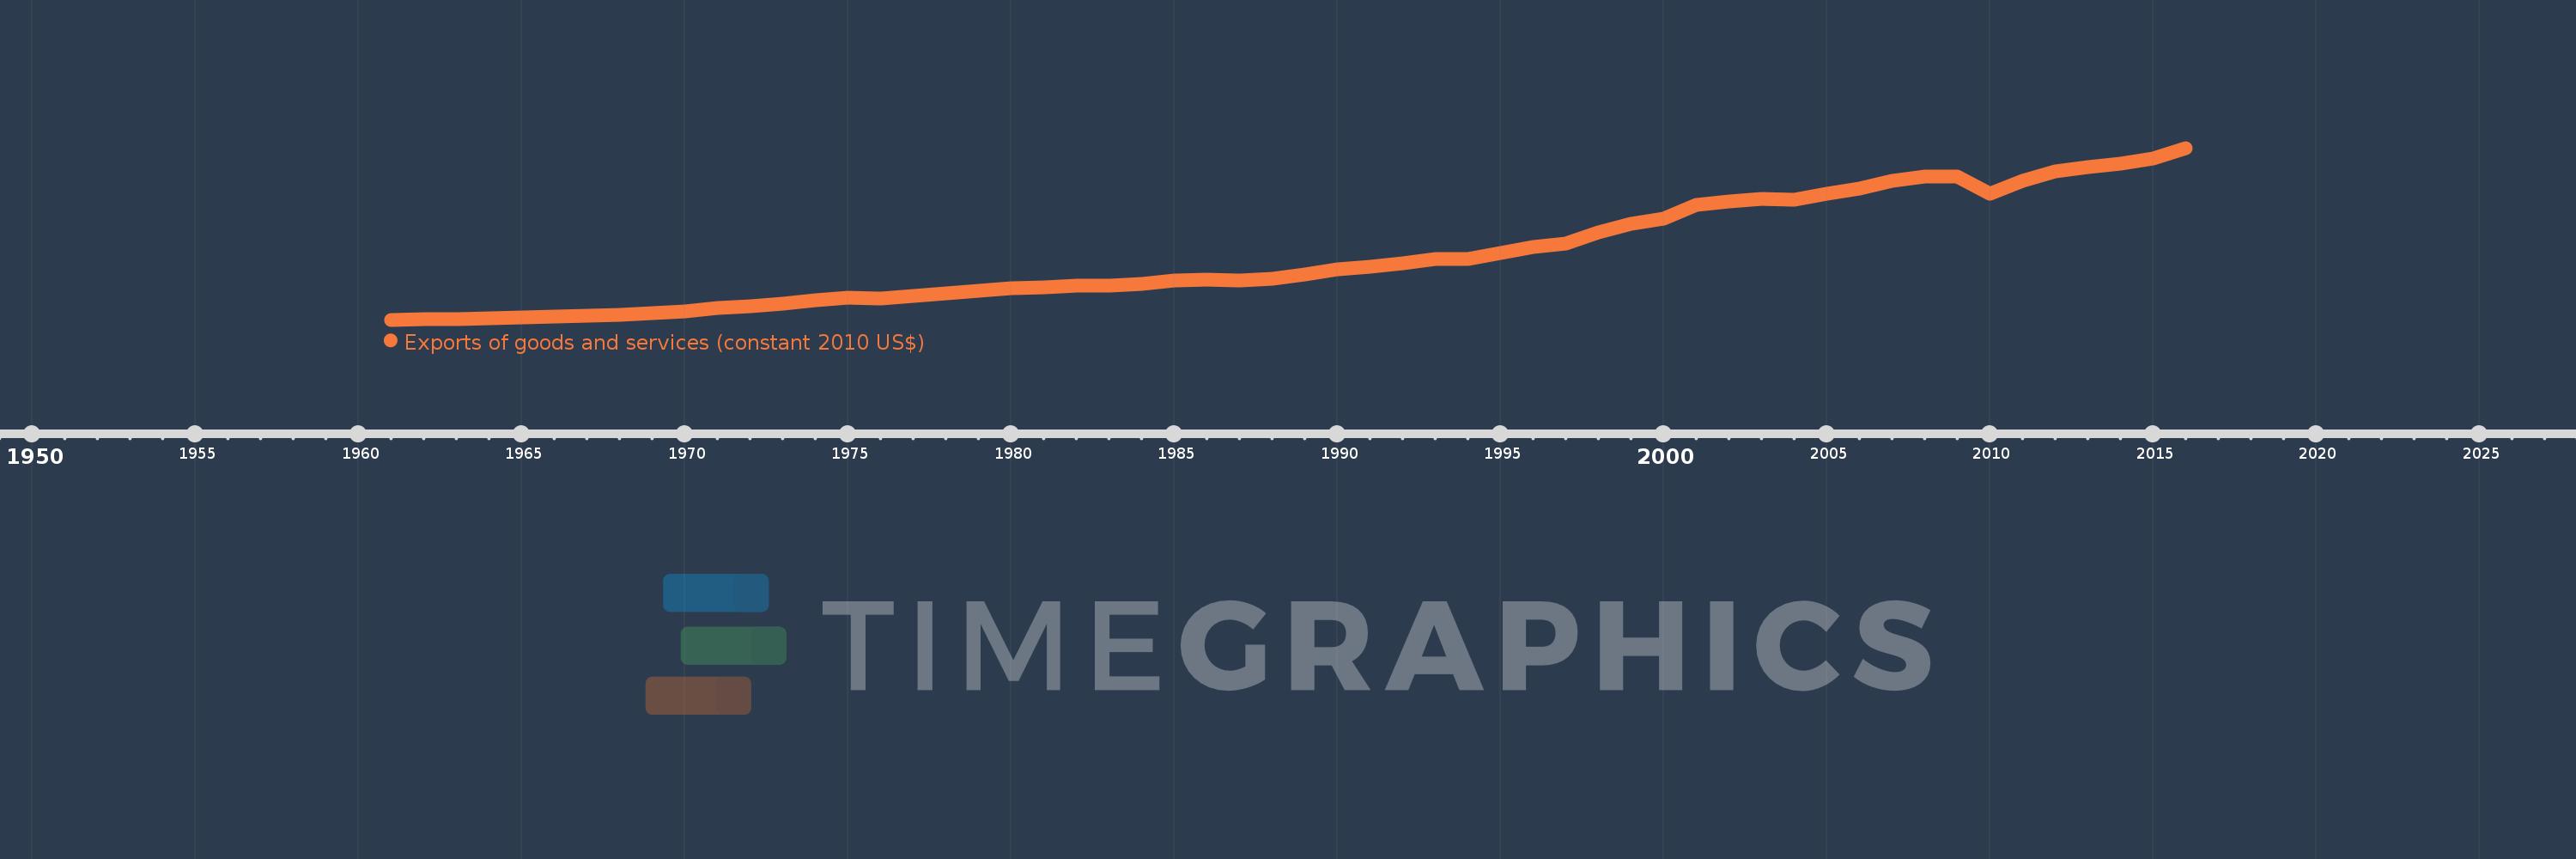
Exports of goods and services (constant 2010 US$)
2016,2015,2014,2013,2012,2011,2010,2009,2008,2007,2006,2005,2004,2003,2002,2001,2000,1999,1998,1997,1996,1995,1994,1993,1992,1991,1990,1989,1988,1987,1986,1985,1984,1983,1982,1981,1980,1979,1978,1977,1976,1975,1974,1973,1972,1971,1970,1969,1968,1967,1966,1965,1964,1963,1962,1961
Estas estadísticas en otros países:
AfghanistanAlbaniaAlgeriaAngolaAntigua and BarbudaArab WorldArgentinaArmeniaArubaAustraliaAustriaAzerbaijanBahamas, TheBahrainBangladeshBarbadosBelarusBelgiumBelizeBeninBermudaBhutanBoliviaBosnia and HerzegovinaBotswanaBrazilBrunei DarussalamBulgariaBurkina FasoBurundiCabo VerdeCambodiaCameroonCanadaCaribbean small statesCentral African RepublicCentral Europe and the BalticsChadChileChinaColombiaComorosCongo, Dem. Rep.Congo, Rep.Costa RicaCote d'IvoireCroatiaCubaCyprusCzech RepublicDenmarkDominicaDominican RepublicEarly-demographic dividendEast Asia & PacificEast Asia & Pacific (excluding high income)East Asia & Pacific (IDA & IBRD countries)EcuadorEgypt, Arab Rep.El SalvadorEquatorial GuineaEritreaEstoniaEuro areaEurope & Central AsiaEurope & Central Asia (excluding high income)Europe & Central Asia (IDA & IBRD countries)European UnionFaroe IslandsFijiFinlandFragile and conflict affected situationsFranceGabonGambia, TheGeorgiaGermanyGhanaGreeceGrenadaGuatemalaGuineaGuinea-BissauGuyanaHaitiHeavily indebted poor countries (HIPC)High incomeHondurasHong Kong SAR, ChinaHungaryIBRD onlyIcelandIDA & IBRD totalIDA blendIDA onlyIDA totalIndiaIndonesiaIran, Islamic Rep.IraqIrelandIsraelItalyJamaicaJapanJordanKazakhstanKenyaKiribatiKorea, Rep.KosovoKuwaitKyrgyz RepublicLao PDRLate-demographic dividendLatin America & Caribbean Latin America & Caribbean (excluding high income)Latin America & the Caribbean (IDA & IBRD countries)LatviaLeast developed countries: UN classificationLebanonLiberiaLibyaLithuaniaLow & middle incomeLow incomeLower middle incomeLuxembourgMacao SAR, ChinaMacedonia, FYRMadagascarMalawiMalaysiaMaldivesMaliMaltaMauritaniaMauritiusMexicoMiddle East & North AfricaMiddle East & North Africa (excluding high income)Middle East & North Africa (IDA & IBRD countries)Middle incomeMoldovaMongoliaMontenegroMoroccoMozambiqueMyanmarNamibiaNepalNetherlandsNew ZealandNicaraguaNigerNigeriaNorth AmericaNorwayOECD membersOmanOther small statesPacific island small statesPakistanPalauPanamaParaguayPeruPhilippinesPolandPortugalPost-demographic dividendPre-demographic dividendPuerto RicoQatarRomaniaRussian FederationRwandaSamoaSaudi ArabiaSenegalSerbiaSeychellesSierra LeoneSingaporeSlovak RepublicSloveniaSmall statesSolomon IslandsSouth AfricaSouth AsiaSouth Asia (IDA & IBRD)South SudanSpainSri LankaSt. Kitts and NevisSt. LuciaSt. Vincent and the GrenadinesSub-Saharan Africa Sub-Saharan Africa (excluding high income)Sub-Saharan Africa (IDA & IBRD countries)SudanSurinameSwazilandSwedenSwitzerlandTajikistanTanzaniaThailandTimor-LesteTogoTongaTrinidad and TobagoTunisiaTurkeyTurkmenistanUgandaUkraineUnited Arab EmiratesUnited KingdomUnited StatesUpper middle incomeUruguayUzbekistanVanuatuVenezuela, RBVietnamWest Bank and GazaWorldYemen, Rep.ZambiaZimbabwe línea de tiempo (timeline):
En esta escala de tiempo se presenta un gráfico de 1961 y 2016 de France. Los datos de 1960 están ausentes. El número de observaciones reales por fecha: 56.
Fuente (nombre):
Indicadores del desarrollo mundial
Fuente (organización):
World Bank national accounts data, and OECD National Accounts data files.
Categorías:
Economy & Growth, Trade
Se ha actualizado:
23 abr 2017 año
Los indicadores de los cambios de valor en los últimos años
Mínimo:
41.505 bn
1 ene 1961 año
Máximo:
844.506 bn
1 ene 2016 año
A la fecha de observación
Valor
Cambio absoluto
El cambio con respecto al valor anterior
1 ene 1961 año
41.505 bn
+41.505 bn
0.0%
1 ene 1962 año
43.629 bn
+2.124 bn
5.12%
1 ene 1963 año
44.4 bn
+770.966 millones
1.77%
1 ene 1964 año
47.535 bn
+3.134 bn
7.06%
1 ene 1965 año
50.697 bn
+3.163 bn
6.65%
1 ene 1966 año
56.535 bn
+5.838 bn
11.52%
1 ene 1967 año
60.269 bn
+3.734 bn
6.6%
1 ene 1968 año
64.661 bn
+4.392 bn
7.29%
1 ene 1969 año
70.751 bn
+6.09 bn
9.42%
1 ene 1970 año
81.88 bn
+11.129 bn
15.73%
1 ene 1971 año
95.079 bn
+13.2 bn
16.12%
1 ene 1972 año
104.42 bn
+9.34 bn
9.82%
1 ene 1973 año
116.136 bn
+11.717 bn
11.22%
1 ene 1974 año
130.675 bn
+14.539 bn
12.52%
1 ene 1975 año
145.764 bn
+15.089 bn
11.55%
1 ene 1976 año
141.105 bn
-4.66 bn
-3.2%
1 ene 1977 año
153.138 bn
+12.033 bn
8.53%
1 ene 1978 año
165.228 bn
+12.09 bn
7.89%
1 ene 1979 año
176.036 bn
+10.808 bn
6.54%
1 ene 1980 año
187.935 bn
+11.899 bn
6.76%
1 ene 1981 año
193.188 bn
+5.253 bn
2.8%
1 ene 1982 año
202.466 bn
+9.278 bn
4.8%
1 ene 1983 año
200.234 bn
-2.232 bn
-1.1%
1 ene 1984 año
209.711 bn
+9.477 bn
4.73%
1 ene 1985 año
223.952 bn
+14.241 bn
6.79%
1 ene 1986 año
228.596 bn
+4.644 bn
2.07%
1 ene 1987 año
226.419 bn
-2.177 bn
-0.95%
1 ene 1988 año
232.837 bn
+6.419 bn
2.83%
1 ene 1989 año
252.584 bn
+19.747 bn
8.48%
1 ene 1990 año
277.43 bn
+24.846 bn
9.84%
1 ene 1991 año
288.948 bn
+11.518 bn
4.15%
1 ene 1992 año
307.003 bn
+18.054 bn
6.25%
1 ene 1993 año
325.07 bn
+18.068 bn
5.89%
1 ene 1994 año
326.328 bn
+1.258 bn
0.39%
1 ene 1995 año
352.714 bn
+26.385 bn
8.09%
1 ene 1996 año
383.436 bn
+30.722 bn
8.71%
1 ene 1997 año
399.238 bn
+15.803 bn
4.12%
1 ene 1998 año
450.719 bn
+51.481 bn
12.89%
1 ene 1999 año
489.359 bn
+38.64 bn
8.57%
1 ene 2000 año
513.78 bn
+24.421 bn
4.99%
1 ene 2001 año
579.098 bn
+65.318 bn
12.71%
1 ene 2002 año
595.686 bn
+16.588 bn
2.86%
1 ene 2003 año
607.064 bn
+11.377 bn
1.91%
1 ene 2004 año
600.57 bn
-6.494 bn
-1.07%
1 ene 2005 año
631.294 bn
+30.725 bn
5.12%
1 ene 2006 año
653.687 bn
+22.393 bn
3.55%
1 ene 2007 año
690.53 bn
+36.842 bn
5.64%
1 ene 2008 año
710.077 bn
+19.547 bn
2.83%
1 ene 2009 año
712.642 bn
+2.566 bn
0.36%
1 ene 2010 año
632.35 bn
-80.293 bn
-11.27%
1 ene 2011 año
689.363 bn
+57.013 bn
9.02%
1 ene 2012 año
736.785 bn
+47.423 bn
6.88%
1 ene 2013 año
755.495 bn
+18.71 bn
2.54%
1 ene 2014 año
769.918 bn
+14.423 bn
1.91%
1 ene 2015 año
795.587 bn
+25.669 bn
3.33%
1 ene 2016 año
844.506 bn
+48.919 bn
6.15%
Ranking de los países por los datos estadísticos actuales


Comentarios: