29
/es/
es
AIzaSyAYiBZKx7MnpbEhh9jyipgxe19OcubqV5w
April 1, 2024
161415
Italy
ITA
true
2
1
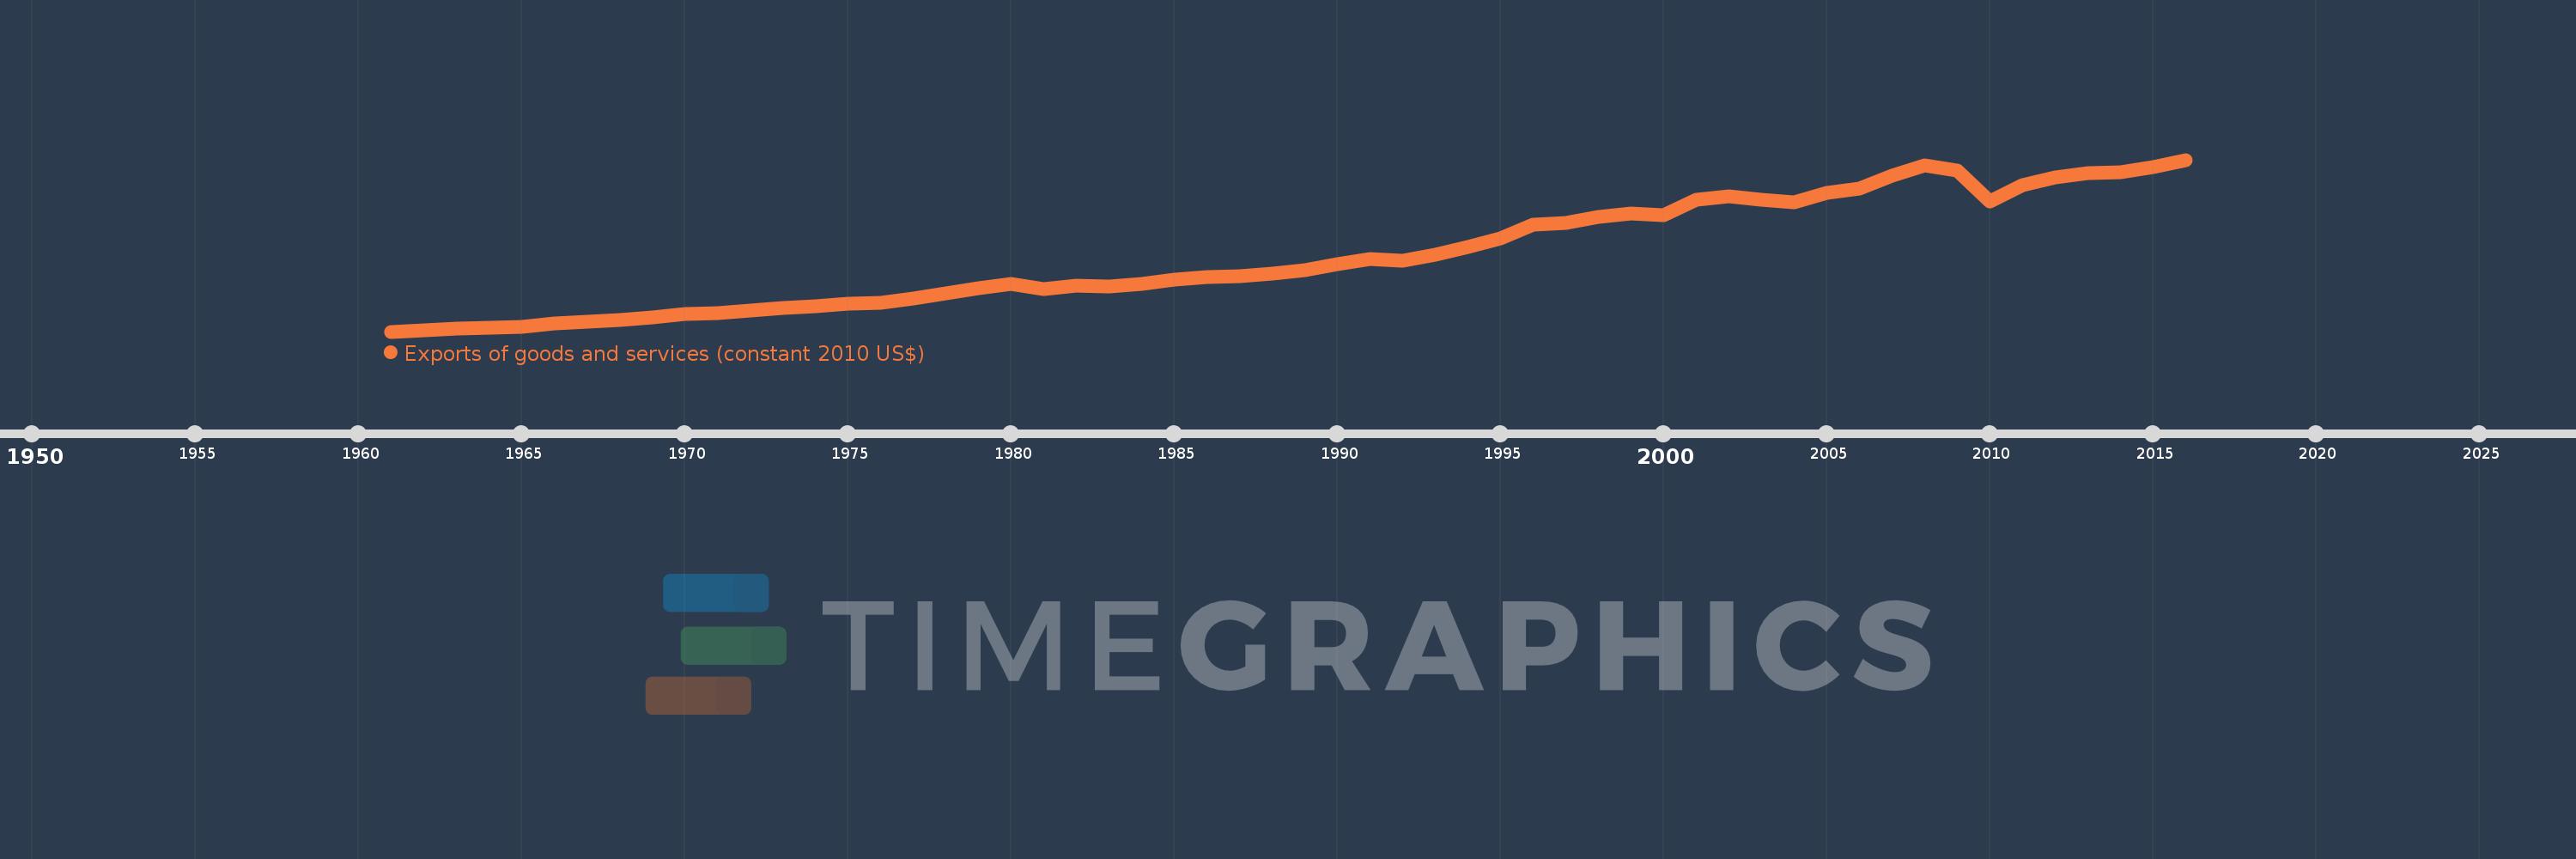
Exports of goods and services (constant 2010 US$)
2016,2015,2014,2013,2012,2011,2010,2009,2008,2007,2006,2005,2004,2003,2002,2001,2000,1999,1998,1997,1996,1995,1994,1993,1992,1991,1990,1989,1988,1987,1986,1985,1984,1983,1982,1981,1980,1979,1978,1977,1976,1975,1974,1973,1972,1971,1970,1969,1968,1967,1966,1965,1964,1963,1962,1961
Estas estadísticas en otros países:
AfghanistanAlbaniaAlgeriaAngolaAntigua and BarbudaArab WorldArgentinaArmeniaArubaAustraliaAustriaAzerbaijanBahamas, TheBahrainBangladeshBarbadosBelarusBelgiumBelizeBeninBermudaBhutanBoliviaBosnia and HerzegovinaBotswanaBrazilBrunei DarussalamBulgariaBurkina FasoBurundiCabo VerdeCambodiaCameroonCanadaCaribbean small statesCentral African RepublicCentral Europe and the BalticsChadChileChinaColombiaComorosCongo, Dem. Rep.Congo, Rep.Costa RicaCote d'IvoireCroatiaCubaCyprusCzech RepublicDenmarkDominicaDominican RepublicEarly-demographic dividendEast Asia & PacificEast Asia & Pacific (excluding high income)East Asia & Pacific (IDA & IBRD countries)EcuadorEgypt, Arab Rep.El SalvadorEquatorial GuineaEritreaEstoniaEuro areaEurope & Central AsiaEurope & Central Asia (excluding high income)Europe & Central Asia (IDA & IBRD countries)European UnionFaroe IslandsFijiFinlandFragile and conflict affected situationsFranceGabonGambia, TheGeorgiaGermanyGhanaGreeceGrenadaGuatemalaGuineaGuinea-BissauGuyanaHaitiHeavily indebted poor countries (HIPC)High incomeHondurasHong Kong SAR, ChinaHungaryIBRD onlyIcelandIDA & IBRD totalIDA blendIDA onlyIDA totalIndiaIndonesiaIran, Islamic Rep.IraqIrelandIsraelItalyJamaicaJapanJordanKazakhstanKenyaKiribatiKorea, Rep.KosovoKuwaitKyrgyz RepublicLao PDRLate-demographic dividendLatin America & Caribbean Latin America & Caribbean (excluding high income)Latin America & the Caribbean (IDA & IBRD countries)LatviaLeast developed countries: UN classificationLebanonLiberiaLibyaLithuaniaLow & middle incomeLow incomeLower middle incomeLuxembourgMacao SAR, ChinaMacedonia, FYRMadagascarMalawiMalaysiaMaldivesMaliMaltaMauritaniaMauritiusMexicoMiddle East & North AfricaMiddle East & North Africa (excluding high income)Middle East & North Africa (IDA & IBRD countries)Middle incomeMoldovaMongoliaMontenegroMoroccoMozambiqueMyanmarNamibiaNepalNetherlandsNew ZealandNicaraguaNigerNigeriaNorth AmericaNorwayOECD membersOmanOther small statesPacific island small statesPakistanPalauPanamaParaguayPeruPhilippinesPolandPortugalPost-demographic dividendPre-demographic dividendPuerto RicoQatarRomaniaRussian FederationRwandaSamoaSaudi ArabiaSenegalSerbiaSeychellesSierra LeoneSingaporeSlovak RepublicSloveniaSmall statesSolomon IslandsSouth AfricaSouth AsiaSouth Asia (IDA & IBRD)South SudanSpainSri LankaSt. Kitts and NevisSt. LuciaSt. Vincent and the GrenadinesSub-Saharan Africa Sub-Saharan Africa (excluding high income)Sub-Saharan Africa (IDA & IBRD countries)SudanSurinameSwazilandSwedenSwitzerlandTajikistanTanzaniaThailandTimor-LesteTogoTongaTrinidad and TobagoTunisiaTurkeyTurkmenistanUgandaUkraineUnited Arab EmiratesUnited KingdomUnited StatesUpper middle incomeUruguayUzbekistanVanuatuVenezuela, RBVietnamWest Bank and GazaWorldYemen, Rep.ZambiaZimbabwe línea de tiempo (timeline):
En esta escala de tiempo se presenta un gráfico de 1961 y 2016 de Italy. Los datos de 1960 están ausentes. El número de observaciones reales por fecha: 56.
Fuente (nombre):
Indicadores del desarrollo mundial
Fuente (organización):
World Bank national accounts data, and OECD National Accounts data files.
Categorías:
Economy & Growth, Trade
Se ha actualizado:
23 abr 2017 año
Los indicadores de los cambios de valor en los últimos años
Mínimo:
34.283 bn
1 ene 1961 año
Máximo:
622.223 bn
1 ene 2016 año
A la fecha de observación
Valor
Cambio absoluto
El cambio con respecto al valor anterior
1 ene 1961 año
34.283 bn
+34.283 bn
0.0%
1 ene 1962 año
39.338 bn
+5.056 bn
14.75%
1 ene 1963 año
43.415 bn
+4.077 bn
10.36%
1 ene 1964 año
46.231 bn
+2.815 bn
6.48%
1 ene 1965 año
51.225 bn
+4.994 bn
10.8%
1 ene 1966 año
61.461 bn
+10.236 bn
19.98%
1 ene 1967 año
68.335 bn
+6.874 bn
11.18%
1 ene 1968 año
73.232 bn
+4.897 bn
7.17%
1 ene 1969 año
83.389 bn
+10.157 bn
13.87%
1 ene 1970 año
93.192 bn
+9.803 bn
11.76%
1 ene 1971 año
98.62 bn
+5.428 bn
5.82%
1 ene 1972 año
105.959 bn
+7.34 bn
7.44%
1 ene 1973 año
114.932 bn
+8.973 bn
8.47%
1 ene 1974 año
121.816 bn
+6.884 bn
5.99%
1 ene 1975 año
130.52 bn
+8.704 bn
7.15%
1 ene 1976 año
132.715 bn
+2.195 bn
1.68%
1 ene 1977 año
148.581 bn
+15.866 bn
11.96%
1 ene 1978 año
164.392 bn
+15.811 bn
10.64%
1 ene 1979 año
182.241 bn
+17.849 bn
10.86%
1 ene 1980 año
196.45 bn
+14.209 bn
7.8%
1 ene 1981 año
180.028 bn
-16.422 bn
-8.36%
1 ene 1982 año
192.339 bn
+12.311 bn
6.84%
1 ene 1983 año
189.826 bn
-2.513 bn
-1.31%
1 ene 1984 año
197.04 bn
+7.214 bn
3.8%
1 ene 1985 año
212.216 bn
+15.176 bn
7.7%
1 ene 1986 año
219.802 bn
+7.586 bn
3.57%
1 ene 1987 año
223.503 bn
+3.701 bn
1.68%
1 ene 1988 año
232.698 bn
+9.195 bn
4.11%
1 ene 1989 año
244.772 bn
+12.074 bn
5.19%
1 ene 1990 año
265.643 bn
+20.872 bn
8.53%
1 ene 1991 año
282.102 bn
+16.459 bn
6.2%
1 ene 1992 año
276.609 bn
-5.493 bn
-1.95%
1 ene 1993 año
296.765 bn
+20.156 bn
7.29%
1 ene 1994 año
323.391 bn
+26.626 bn
8.97%
1 ene 1995 año
354.524 bn
+31.133 bn
9.63%
1 ene 1996 año
399.133 bn
+44.609 bn
12.58%
1 ene 1997 año
405.742 bn
+6.61 bn
1.66%
1 ene 1998 año
426.217 bn
+20.474 bn
5.05%
1 ene 1999 año
437.855 bn
+11.638 bn
2.73%
1 ene 2000 año
433.655 bn
-4.2 bn
-0.96%
1 ene 2001 año
485.371 bn
+51.716 bn
11.93%
1 ene 2002 año
498.352 bn
+12.981 bn
2.67%
1 ene 2003 año
484.431 bn
-13.921 bn
-2.79%
1 ene 2004 año
478.135 bn
-6.296 bn
-1.3%
1 ene 2005 año
507.596 bn
+29.461 bn
6.16%
1 ene 2006 año
524.735 bn
+17.14 bn
3.38%
1 ene 2007 año
567.906 bn
+43.171 bn
8.23%
1 ene 2008 año
602.977 bn
+35.071 bn
6.18%
1 ene 2009 año
584.335 bn
-18.642 bn
-3.09%
1 ene 2010 año
478.859 bn
-105.476 bn
-18.05%
1 ene 2011 año
535.296 bn
+56.437 bn
11.79%
1 ene 2012 año
563.056 bn
+27.76 bn
5.19%
1 ene 2013 año
576.141 bn
+13.085 bn
2.32%
1 ene 2014 año
580.179 bn
+4.037 bn
0.7%
1 ene 2015 año
596.847 bn
+16.668 bn
2.87%
1 ene 2016 año
622.223 bn
+25.376 bn
4.25%
Ranking de los países por los datos estadísticos actuales


Comentarios: