29
/es/
es
AIzaSyAYiBZKx7MnpbEhh9jyipgxe19OcubqV5w
April 1, 2024
245515
South Africa
ZAF
true
2
1
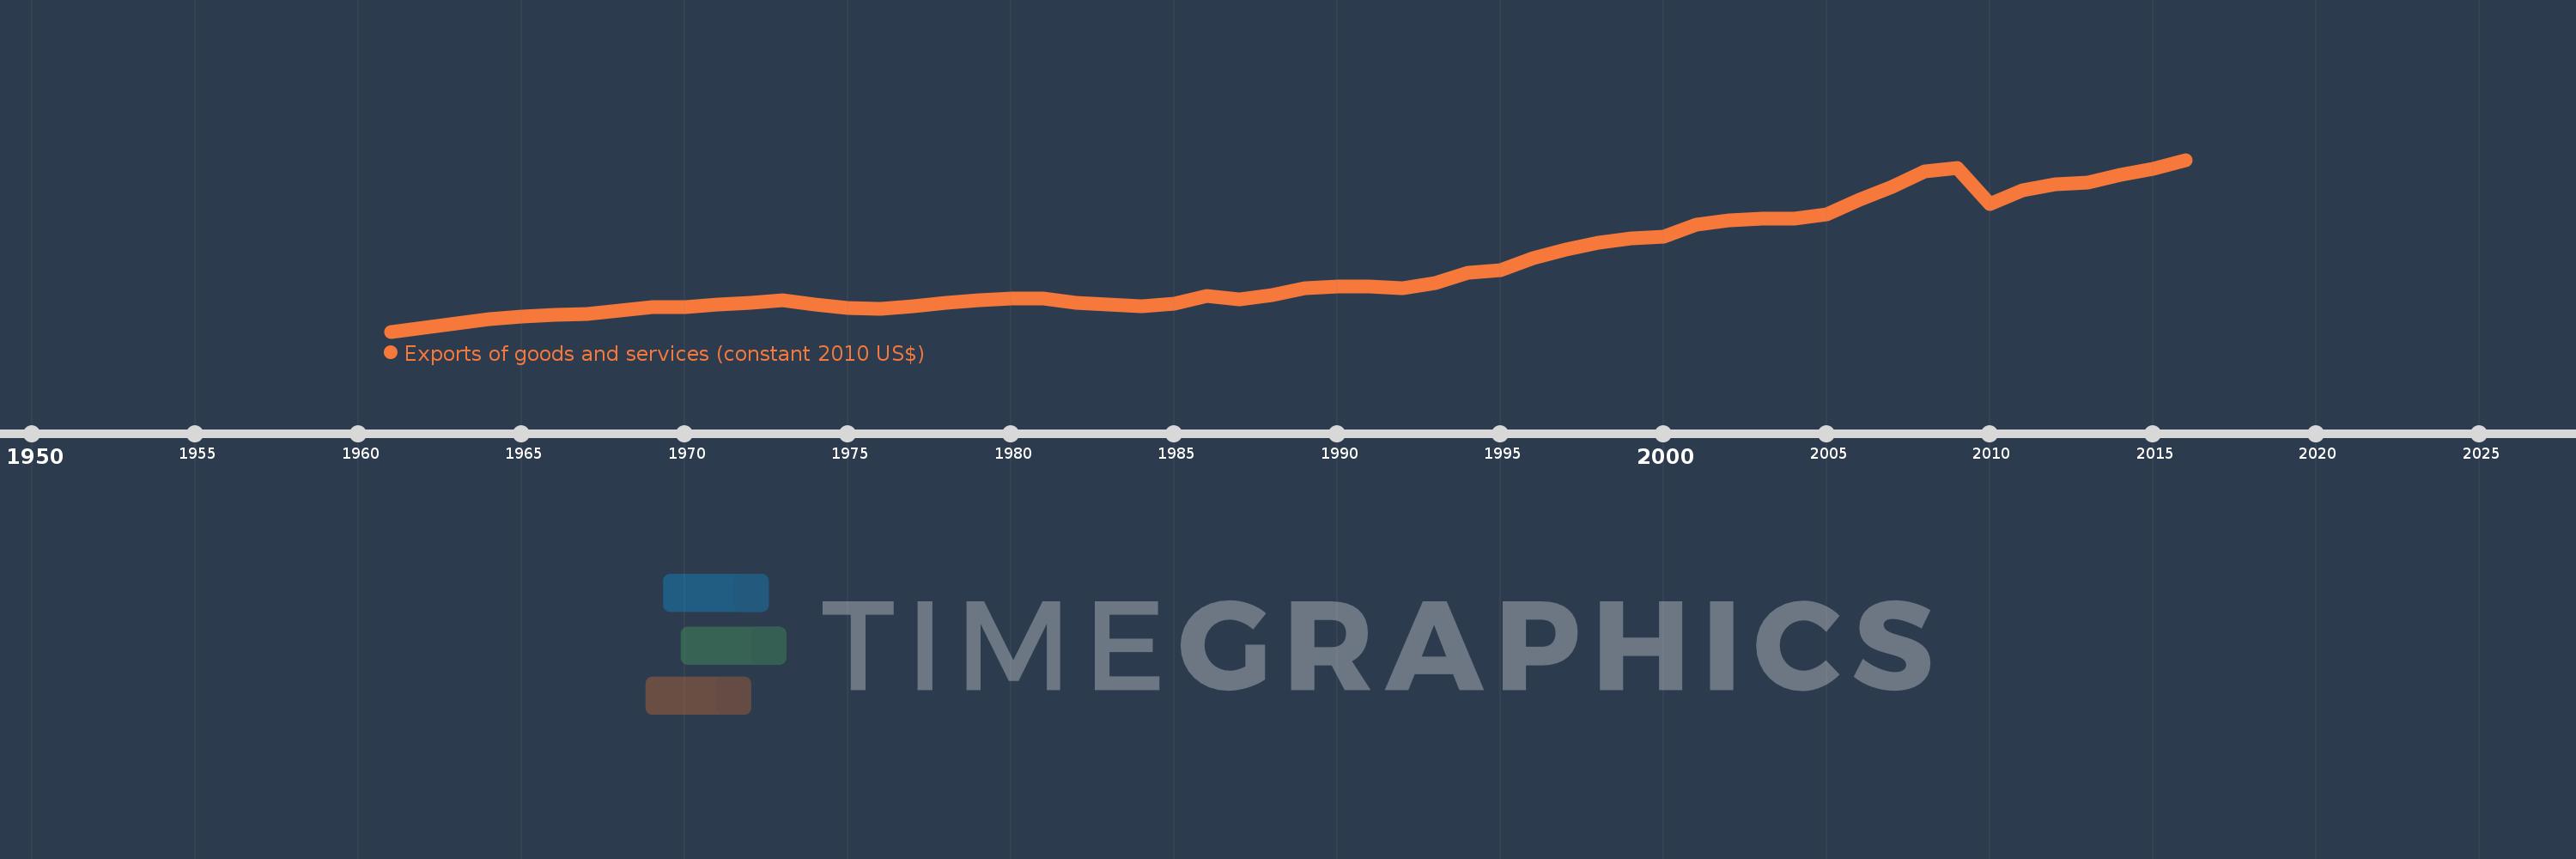
Exports of goods and services (constant 2010 US$)
2016,2015,2014,2013,2012,2011,2010,2009,2008,2007,2006,2005,2004,2003,2002,2001,2000,1999,1998,1997,1996,1995,1994,1993,1992,1991,1990,1989,1988,1987,1986,1985,1984,1983,1982,1981,1980,1979,1978,1977,1976,1975,1974,1973,1972,1971,1970,1969,1968,1967,1966,1965,1964,1963,1962,1961
Estas estadísticas en otros países:
AfghanistanAlbaniaAlgeriaAngolaAntigua and BarbudaArab WorldArgentinaArmeniaArubaAustraliaAustriaAzerbaijanBahamas, TheBahrainBangladeshBarbadosBelarusBelgiumBelizeBeninBermudaBhutanBoliviaBosnia and HerzegovinaBotswanaBrazilBrunei DarussalamBulgariaBurkina FasoBurundiCabo VerdeCambodiaCameroonCanadaCaribbean small statesCentral African RepublicCentral Europe and the BalticsChadChileChinaColombiaComorosCongo, Dem. Rep.Congo, Rep.Costa RicaCote d'IvoireCroatiaCubaCyprusCzech RepublicDenmarkDominicaDominican RepublicEarly-demographic dividendEast Asia & PacificEast Asia & Pacific (excluding high income)East Asia & Pacific (IDA & IBRD countries)EcuadorEgypt, Arab Rep.El SalvadorEquatorial GuineaEritreaEstoniaEuro areaEurope & Central AsiaEurope & Central Asia (excluding high income)Europe & Central Asia (IDA & IBRD countries)European UnionFaroe IslandsFijiFinlandFragile and conflict affected situationsFranceGabonGambia, TheGeorgiaGermanyGhanaGreeceGrenadaGuatemalaGuineaGuinea-BissauGuyanaHaitiHeavily indebted poor countries (HIPC)High incomeHondurasHong Kong SAR, ChinaHungaryIBRD onlyIcelandIDA & IBRD totalIDA blendIDA onlyIDA totalIndiaIndonesiaIran, Islamic Rep.IraqIrelandIsraelItalyJamaicaJapanJordanKazakhstanKenyaKiribatiKorea, Rep.KosovoKuwaitKyrgyz RepublicLao PDRLate-demographic dividendLatin America & Caribbean Latin America & Caribbean (excluding high income)Latin America & the Caribbean (IDA & IBRD countries)LatviaLeast developed countries: UN classificationLebanonLiberiaLibyaLithuaniaLow & middle incomeLow incomeLower middle incomeLuxembourgMacao SAR, ChinaMacedonia, FYRMadagascarMalawiMalaysiaMaldivesMaliMaltaMauritaniaMauritiusMexicoMiddle East & North AfricaMiddle East & North Africa (excluding high income)Middle East & North Africa (IDA & IBRD countries)Middle incomeMoldovaMongoliaMontenegroMoroccoMozambiqueMyanmarNamibiaNepalNetherlandsNew ZealandNicaraguaNigerNigeriaNorth AmericaNorwayOECD membersOmanOther small statesPacific island small statesPakistanPalauPanamaParaguayPeruPhilippinesPolandPortugalPost-demographic dividendPre-demographic dividendPuerto RicoQatarRomaniaRussian FederationRwandaSamoaSaudi ArabiaSenegalSerbiaSeychellesSierra LeoneSingaporeSlovak RepublicSloveniaSmall statesSolomon IslandsSouth AfricaSouth AsiaSouth Asia (IDA & IBRD)South SudanSpainSri LankaSt. Kitts and NevisSt. LuciaSt. Vincent and the GrenadinesSub-Saharan Africa Sub-Saharan Africa (excluding high income)Sub-Saharan Africa (IDA & IBRD countries)SudanSurinameSwazilandSwedenSwitzerlandTajikistanTanzaniaThailandTimor-LesteTogoTongaTrinidad and TobagoTunisiaTurkeyTurkmenistanUgandaUkraineUnited Arab EmiratesUnited KingdomUnited StatesUpper middle incomeUruguayUzbekistanVanuatuVenezuela, RBVietnamWest Bank and GazaWorldYemen, Rep.ZambiaZimbabwe línea de tiempo (timeline):
En esta escala de tiempo se presenta un gráfico de 1961 y 2016 de South Africa. Los datos de 1960 están ausentes. El número de observaciones reales por fecha: 56.
Fuente (nombre):
Indicadores del desarrollo mundial
Fuente (organización):
World Bank national accounts data, and OECD National Accounts data files.
Categorías:
Economy & Growth, Trade
Se ha actualizado:
23 abr 2017 año
Los indicadores de los cambios de valor en los últimos años
Mínimo:
27.802 bn
1 ene 1961 año
Máximo:
124.837 bn
1 ene 2016 año
A la fecha de observación
Valor
Cambio absoluto
El cambio con respecto al valor anterior
1 ene 1961 año
27.802 bn
+27.802 bn
0.0%
1 ene 1962 año
29.769 bn
+1.967 bn
7.07%
1 ene 1963 año
32.29 bn
+2.521 bn
8.47%
1 ene 1964 año
34.752 bn
+2.462 bn
7.62%
1 ene 1965 año
36.467 bn
+1.715 bn
4.94%
1 ene 1966 año
37.4 bn
+933.138 millones
2.56%
1 ene 1967 año
37.906 bn
+505.189 millones
1.35%
1 ene 1968 año
39.738 bn
+1.832 bn
4.83%
1 ene 1969 año
41.387 bn
+1.649 bn
4.15%
1 ene 1970 año
41.704 bn
+316.455 millones
0.76%
1 ene 1971 año
42.846 bn
+1.142 bn
2.74%
1 ene 1972 año
44.166 bn
+1.32 bn
3.08%
1 ene 1973 año
45.491 bn
+1.325 bn
3.0%
1 ene 1974 año
43.134 bn
-2.357 bn
-5.18%
1 ene 1975 año
41.024 bn
-2.11 bn
-4.89%
1 ene 1976 año
40.549 bn
-475.514 millones
-1.16%
1 ene 1977 año
42.292 bn
+1.743 bn
4.3%
1 ene 1978 año
44.238 bn
+1.946 bn
4.6%
1 ene 1979 año
45.697 bn
+1.459 bn
3.3%
1 ene 1980 año
46.538 bn
+841.112 millones
1.84%
1 ene 1981 año
46.537 bn
-1.424 millones
0.0%
1 ene 1982 año
44.045 bn
-2.491 bn
-5.35%
1 ene 1983 año
42.88 bn
-1.165 bn
-2.64%
1 ene 1984 año
42.311 bn
-569.525 millones
-1.33%
1 ene 1985 año
43.439 bn
+1.128 bn
2.67%
1 ene 1986 año
47.816 bn
+4.377 bn
10.08%
1 ene 1987 año
46.052 bn
-1.765 bn
-3.69%
1 ene 1988 año
48.192 bn
+2.141 bn
4.65%
1 ene 1989 año
52.13 bn
+3.937 bn
8.17%
1 ene 1990 año
53.267 bn
+1.137 bn
2.18%
1 ene 1991 año
53.036 bn
-231.229 millones
-0.43%
1 ene 1992 año
52.216 bn
-819.508 millones
-1.55%
1 ene 1993 año
55.083 bn
+2.867 bn
5.49%
1 ene 1994 año
60.8 bn
+5.717 bn
10.38%
1 ene 1995 año
62.311 bn
+1.511 bn
2.49%
1 ene 1996 año
69.127 bn
+6.816 bn
10.94%
1 ene 1997 año
74.107 bn
+4.98 bn
7.2%
1 ene 1998 año
78.031 bn
+3.924 bn
5.3%
1 ene 1999 año
80.564 bn
+2.533 bn
3.25%
1 ene 2000 año
81.58 bn
+1.016 bn
1.26%
1 ene 2001 año
88.362 bn
+6.782 bn
8.31%
1 ene 2002 año
90.477 bn
+2.114 bn
2.39%
1 ene 2003 año
91.372 bn
+894.935 millones
0.99%
1 ene 2004 año
91.472 bn
+99.984 millones
0.11%
1 ene 2005 año
94.064 bn
+2.592 bn
2.83%
1 ene 2006 año
102.123 bn
+8.059 bn
8.57%
1 ene 2007 año
109.744 bn
+7.621 bn
7.46%
1 ene 2008 año
118.335 bn
+8.591 bn
7.83%
1 ene 2009 año
120.169 bn
+1.834 bn
1.55%
1 ene 2010 año
99.711 bn
-20.457 bn
-17.02%
1 ene 2011 año
107.407 bn
+7.696 bn
7.72%
1 ene 2012 año
111.162 bn
+3.755 bn
3.5%
1 ene 2013 año
112.045 bn
+882.506 millones
0.79%
1 ene 2014 año
116.115 bn
+4.071 bn
3.63%
1 ene 2015 año
119.926 bn
+3.81 bn
3.28%
1 ene 2016 año
124.837 bn
+4.912 bn
4.1%
Ranking de los países por los datos estadísticos actuales


Comentarios: