29
/es/
es
AIzaSyAYiBZKx7MnpbEhh9jyipgxe19OcubqV5w
April 1, 2024
166074
Kazakhstan
KAZ
true
2
1
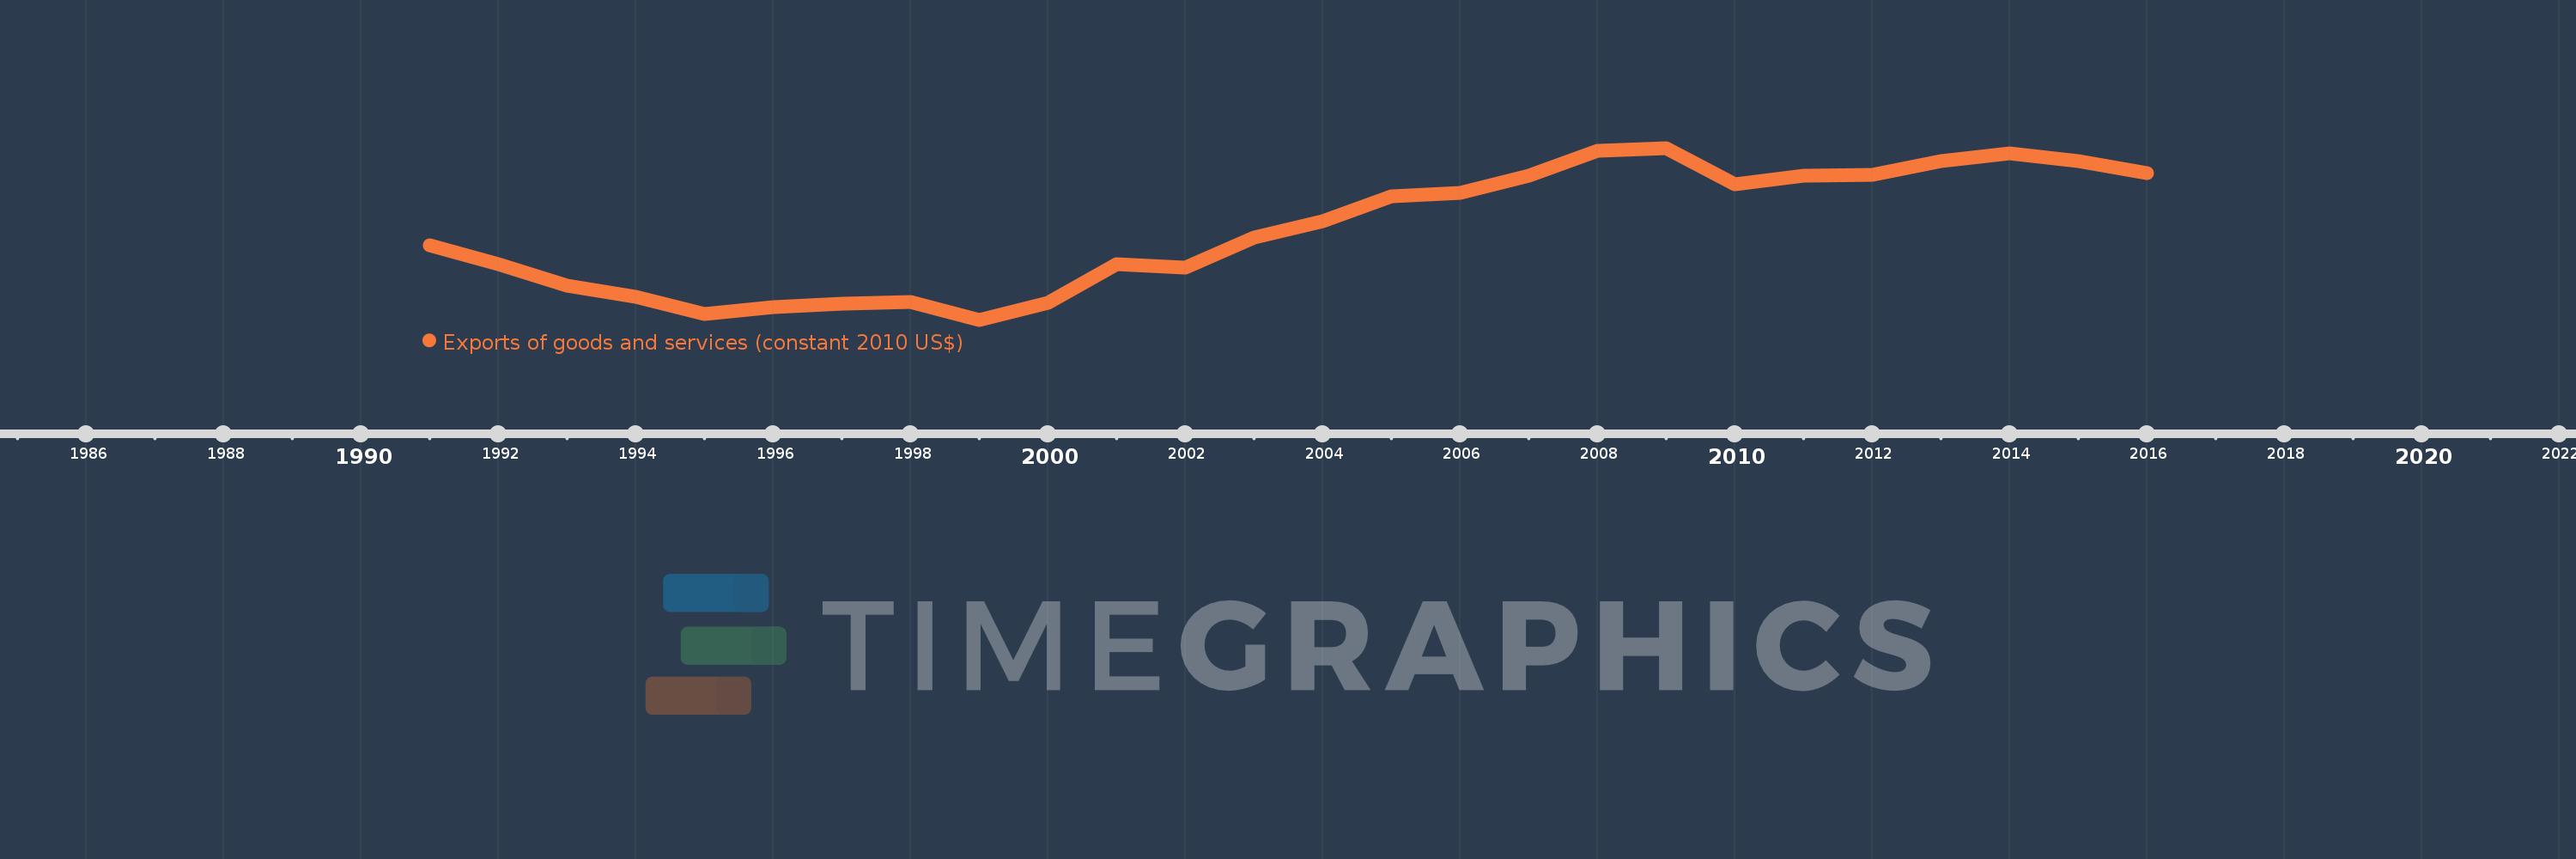
Exports of goods and services (constant 2010 US$)
2016,2015,2014,2013,2012,2011,2010,2009,2008,2007,2006,2005,2004,2003,2002,2001,2000,1999,1998,1997,1996,1995,1994,1993,1992,1991
Estas estadísticas en otros países:
AfghanistanAlbaniaAlgeriaAngolaAntigua and BarbudaArab WorldArgentinaArmeniaArubaAustraliaAustriaAzerbaijanBahamas, TheBahrainBangladeshBarbadosBelarusBelgiumBelizeBeninBermudaBhutanBoliviaBosnia and HerzegovinaBotswanaBrazilBrunei DarussalamBulgariaBurkina FasoBurundiCabo VerdeCambodiaCameroonCanadaCaribbean small statesCentral African RepublicCentral Europe and the BalticsChadChileChinaColombiaComorosCongo, Dem. Rep.Congo, Rep.Costa RicaCote d'IvoireCroatiaCubaCyprusCzech RepublicDenmarkDominicaDominican RepublicEarly-demographic dividendEast Asia & PacificEast Asia & Pacific (excluding high income)East Asia & Pacific (IDA & IBRD countries)EcuadorEgypt, Arab Rep.El SalvadorEquatorial GuineaEritreaEstoniaEuro areaEurope & Central AsiaEurope & Central Asia (excluding high income)Europe & Central Asia (IDA & IBRD countries)European UnionFaroe IslandsFijiFinlandFragile and conflict affected situationsFranceGabonGambia, TheGeorgiaGermanyGhanaGreeceGrenadaGuatemalaGuineaGuinea-BissauGuyanaHaitiHeavily indebted poor countries (HIPC)High incomeHondurasHong Kong SAR, ChinaHungaryIBRD onlyIcelandIDA & IBRD totalIDA blendIDA onlyIDA totalIndiaIndonesiaIran, Islamic Rep.IraqIrelandIsraelItalyJamaicaJapanJordanKazakhstanKenyaKiribatiKorea, Rep.KosovoKuwaitKyrgyz RepublicLao PDRLate-demographic dividendLatin America & Caribbean Latin America & Caribbean (excluding high income)Latin America & the Caribbean (IDA & IBRD countries)LatviaLeast developed countries: UN classificationLebanonLiberiaLibyaLithuaniaLow & middle incomeLow incomeLower middle incomeLuxembourgMacao SAR, ChinaMacedonia, FYRMadagascarMalawiMalaysiaMaldivesMaliMaltaMauritaniaMauritiusMexicoMiddle East & North AfricaMiddle East & North Africa (excluding high income)Middle East & North Africa (IDA & IBRD countries)Middle incomeMoldovaMongoliaMontenegroMoroccoMozambiqueMyanmarNamibiaNepalNetherlandsNew ZealandNicaraguaNigerNigeriaNorth AmericaNorwayOECD membersOmanOther small statesPacific island small statesPakistanPalauPanamaParaguayPeruPhilippinesPolandPortugalPost-demographic dividendPre-demographic dividendPuerto RicoQatarRomaniaRussian FederationRwandaSamoaSaudi ArabiaSenegalSerbiaSeychellesSierra LeoneSingaporeSlovak RepublicSloveniaSmall statesSolomon IslandsSouth AfricaSouth AsiaSouth Asia (IDA & IBRD)South SudanSpainSri LankaSt. Kitts and NevisSt. LuciaSt. Vincent and the GrenadinesSub-Saharan Africa Sub-Saharan Africa (excluding high income)Sub-Saharan Africa (IDA & IBRD countries)SudanSurinameSwazilandSwedenSwitzerlandTajikistanTanzaniaThailandTimor-LesteTogoTongaTrinidad and TobagoTunisiaTurkeyTurkmenistanUgandaUkraineUnited Arab EmiratesUnited KingdomUnited StatesUpper middle incomeUruguayUzbekistanVanuatuVenezuela, RBVietnamWest Bank and GazaWorldYemen, Rep.ZambiaZimbabwe línea de tiempo (timeline):
En esta escala de tiempo se presenta un gráfico de 1991 y 2016 de Kazakhstan. Los datos de 1990 están ausentes. El número de observaciones reales por fecha: 26.
Fuente (nombre):
Indicadores del desarrollo mundial
Fuente (organización):
World Bank national accounts data, and OECD National Accounts data files.
Categorías:
Economy & Growth, Trade
Se ha actualizado:
23 abr 2017 año
Los indicadores de los cambios de valor en los últimos años
Mínimo:
31.166 bn
1 ene 1999 año
Máximo:
72.114 bn
1 ene 2009 año
A la fecha de observación
Valor
Cambio absoluto
El cambio con respecto al valor anterior
1 ene 1991 año
48.859 bn
+48.859 bn
0.0%
1 ene 1992 año
44.461 bn
-4.397 bn
-9.0%
1 ene 1993 año
39.348 bn
-5.113 bn
-11.5%
1 ene 1994 año
36.673 bn
-2.676 bn
-6.8%
1 ene 1995 año
32.639 bn
-4.034 bn
-11.0%
1 ene 1996 año
34.271 bn
+1.632 bn
5.0%
1 ene 1997 año
34.956 bn
+685.41 millones
2.0%
1 ene 1998 año
35.375 bn
+419.471 millones
1.2%
1 ene 1999 año
31.166 bn
-4.21 bn
-11.9%
1 ene 2000 año
35.124 bn
+3.958 bn
12.7%
1 ene 2001 año
44.326 bn
+9.202 bn
26.2%
1 ene 2002 año
43.528 bn
-797.872 millones
-1.8%
1 ene 2003 año
50.754 bn
+7.226 bn
16.6%
1 ene 2004 año
54.561 bn
+3.807 bn
7.5%
1 ene 2005 año
60.671 bn
+6.111 bn
11.2%
1 ene 2006 año
61.339 bn
+667.385 millones
1.1%
1 ene 2007 año
65.51 bn
+4.171 bn
6.8%
1 ene 2008 año
71.471 bn
+5.961 bn
9.1%
1 ene 2009 año
72.114 bn
+643.241 millones
0.9%
1 ene 2010 año
63.533 bn
-8.582 bn
-11.9%
1 ene 2011 año
65.502 bn
+1.97 bn
3.1%
1 ene 2012 año
65.764 bn
+262.01 millones
0.4%
1 ene 2013 año
68.921 bn
+3.157 bn
4.8%
1 ene 2014 año
70.782 bn
+1.861 bn
2.7%
1 ene 2015 año
69.012 bn
-1.77 bn
-2.5%
1 ene 2016 año
66.114 bn
-2.899 bn
-4.2%
Ranking de los países por los datos estadísticos actuales


Comentarios: