29
/es/
es
AIzaSyAYiBZKx7MnpbEhh9jyipgxe19OcubqV5w
April 1, 2024
257254
Switzerland
CHE
true
2
1
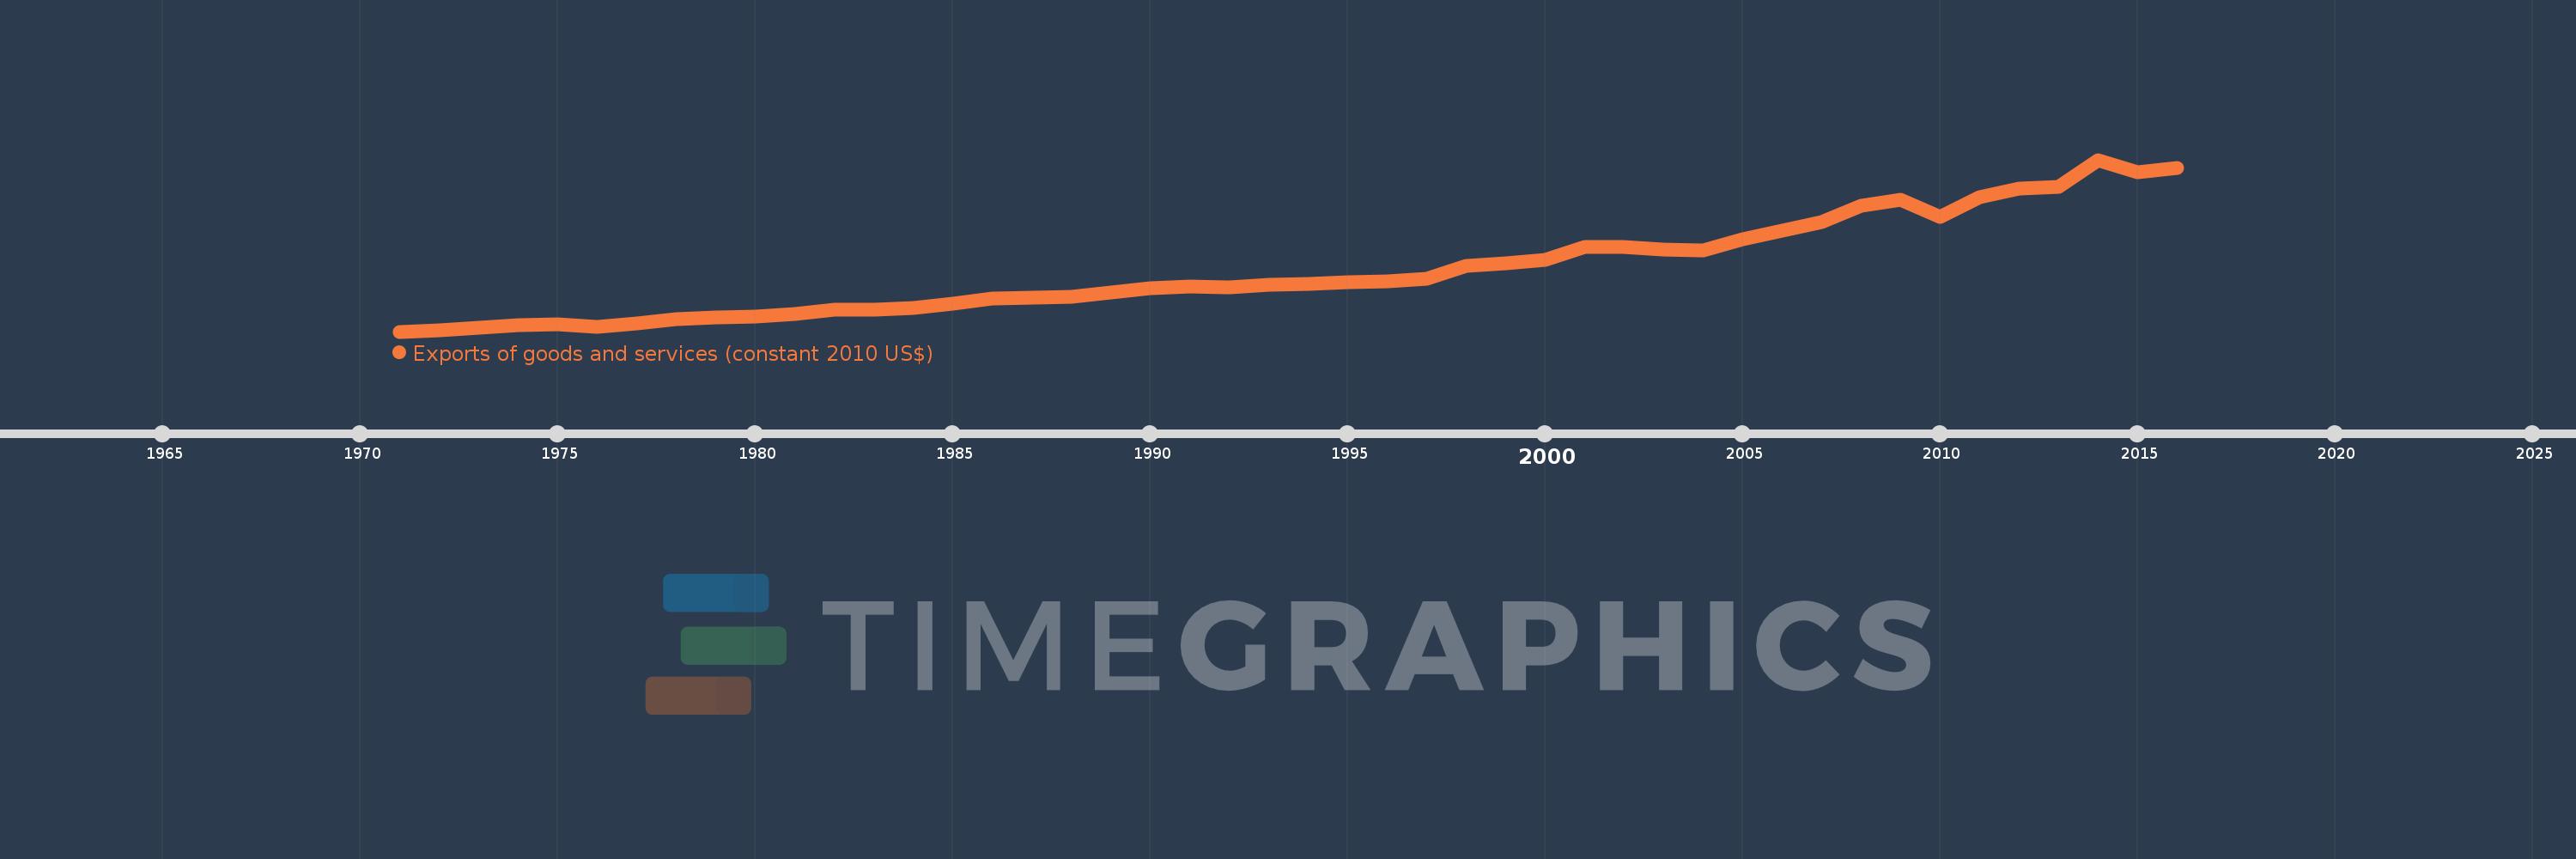
Exports of goods and services (constant 2010 US$)
2016,2015,2014,2013,2012,2011,2010,2009,2008,2007,2006,2005,2004,2003,2002,2001,2000,1999,1998,1997,1996,1995,1994,1993,1992,1991,1990,1989,1988,1987,1986,1985,1984,1983,1982,1981,1980,1979,1978,1977,1976,1975,1974,1973,1972,1971
Estas estadísticas en otros países:
AfghanistanAlbaniaAlgeriaAngolaAntigua and BarbudaArab WorldArgentinaArmeniaArubaAustraliaAustriaAzerbaijanBahamas, TheBahrainBangladeshBarbadosBelarusBelgiumBelizeBeninBermudaBhutanBoliviaBosnia and HerzegovinaBotswanaBrazilBrunei DarussalamBulgariaBurkina FasoBurundiCabo VerdeCambodiaCameroonCanadaCaribbean small statesCentral African RepublicCentral Europe and the BalticsChadChileChinaColombiaComorosCongo, Dem. Rep.Congo, Rep.Costa RicaCote d'IvoireCroatiaCubaCyprusCzech RepublicDenmarkDominicaDominican RepublicEarly-demographic dividendEast Asia & PacificEast Asia & Pacific (excluding high income)East Asia & Pacific (IDA & IBRD countries)EcuadorEgypt, Arab Rep.El SalvadorEquatorial GuineaEritreaEstoniaEuro areaEurope & Central AsiaEurope & Central Asia (excluding high income)Europe & Central Asia (IDA & IBRD countries)European UnionFaroe IslandsFijiFinlandFragile and conflict affected situationsFranceGabonGambia, TheGeorgiaGermanyGhanaGreeceGrenadaGuatemalaGuineaGuinea-BissauGuyanaHaitiHeavily indebted poor countries (HIPC)High incomeHondurasHong Kong SAR, ChinaHungaryIBRD onlyIcelandIDA & IBRD totalIDA blendIDA onlyIDA totalIndiaIndonesiaIran, Islamic Rep.IraqIrelandIsraelItalyJamaicaJapanJordanKazakhstanKenyaKiribatiKorea, Rep.KosovoKuwaitKyrgyz RepublicLao PDRLate-demographic dividendLatin America & Caribbean Latin America & Caribbean (excluding high income)Latin America & the Caribbean (IDA & IBRD countries)LatviaLeast developed countries: UN classificationLebanonLiberiaLibyaLithuaniaLow & middle incomeLow incomeLower middle incomeLuxembourgMacao SAR, ChinaMacedonia, FYRMadagascarMalawiMalaysiaMaldivesMaliMaltaMauritaniaMauritiusMexicoMiddle East & North AfricaMiddle East & North Africa (excluding high income)Middle East & North Africa (IDA & IBRD countries)Middle incomeMoldovaMongoliaMontenegroMoroccoMozambiqueMyanmarNamibiaNepalNetherlandsNew ZealandNicaraguaNigerNigeriaNorth AmericaNorwayOECD membersOmanOther small statesPacific island small statesPakistanPalauPanamaParaguayPeruPhilippinesPolandPortugalPost-demographic dividendPre-demographic dividendPuerto RicoQatarRomaniaRussian FederationRwandaSamoaSaudi ArabiaSenegalSerbiaSeychellesSierra LeoneSingaporeSlovak RepublicSloveniaSmall statesSolomon IslandsSouth AfricaSouth AsiaSouth Asia (IDA & IBRD)South SudanSpainSri LankaSt. Kitts and NevisSt. LuciaSt. Vincent and the GrenadinesSub-Saharan Africa Sub-Saharan Africa (excluding high income)Sub-Saharan Africa (IDA & IBRD countries)SudanSurinameSwazilandSwedenSwitzerlandTajikistanTanzaniaThailandTimor-LesteTogoTongaTrinidad and TobagoTunisiaTurkeyTurkmenistanUgandaUkraineUnited Arab EmiratesUnited KingdomUnited StatesUpper middle incomeUruguayUzbekistanVanuatuVenezuela, RBVietnamWest Bank and GazaWorldYemen, Rep.ZambiaZimbabwe línea de tiempo (timeline):
En esta escala de tiempo se presenta un gráfico de 1971 y 2016 de Switzerland. Los datos de 1970 están ausentes. El número de observaciones reales por fecha: 46.
Fuente (nombre):
Indicadores del desarrollo mundial
Fuente (organización):
World Bank national accounts data, and OECD National Accounts data files.
Categorías:
Economy & Growth, Trade
Se ha actualizado:
23 abr 2017 año
Los indicadores de los cambios de valor en los últimos años
Mínimo:
76.358 bn
1 ene 1971 año
Máximo:
456.341 bn
1 ene 2014 año
A la fecha de observación
Valor
Cambio absoluto
El cambio con respecto al valor anterior
1 ene 1971 año
76.358 bn
+76.358 bn
0.0%
1 ene 1972 año
79.327 bn
+2.968 bn
3.89%
1 ene 1973 año
84.377 bn
+5.05 bn
6.37%
1 ene 1974 año
91.008 bn
+6.631 bn
7.86%
1 ene 1975 año
91.946 bn
+938.096 millones
1.03%
1 ene 1976 año
85.906 bn
-6.04 bn
-6.57%
1 ene 1977 año
93.9 bn
+7.993 bn
9.3%
1 ene 1978 año
103.023 bn
+9.124 bn
9.72%
1 ene 1979 año
106.853 bn
+3.829 bn
3.72%
1 ene 1980 año
109.487 bn
+2.634 bn
2.47%
1 ene 1981 año
115.039 bn
+5.551 bn
5.07%
1 ene 1982 año
125.252 bn
+10.213 bn
8.88%
1 ene 1983 año
125.263 bn
+11.0 millones
0.01%
1 ene 1984 año
127.857 bn
+2.594 bn
2.07%
1 ene 1985 año
138.382 bn
+10.525 bn
8.23%
1 ene 1986 año
149.542 bn
+11.16 bn
8.06%
1 ene 1987 año
151.719 bn
+2.177 bn
1.46%
1 ene 1988 año
154.097 bn
+2.378 bn
1.57%
1 ene 1989 año
162.638 bn
+8.541 bn
5.54%
1 ene 1990 año
171.467 bn
+8.829 bn
5.43%
1 ene 1991 año
176.547 bn
+5.08 bn
2.96%
1 ene 1992 año
174.325 bn
-2.223 bn
-1.26%
1 ene 1993 año
180.04 bn
+5.716 bn
3.28%
1 ene 1994 año
182.1 bn
+2.06 bn
1.14%
1 ene 1995 año
185.958 bn
+3.858 bn
2.12%
1 ene 1996 año
187.69 bn
+1.732 bn
0.93%
1 ene 1997 año
193.458 bn
+5.768 bn
3.07%
1 ene 1998 año
222.016 bn
+28.557 bn
14.76%
1 ene 1999 año
227.886 bn
+5.87 bn
2.64%
1 ene 2000 año
235.357 bn
+7.471 bn
3.28%
1 ene 2001 año
264.054 bn
+28.697 bn
12.19%
1 ene 2002 año
264.013 bn
-40.519 millones
-0.02%
1 ene 2003 año
258.692 bn
-5.321 bn
-2.02%
1 ene 2004 año
256.175 bn
-2.517 bn
-0.97%
1 ene 2005 año
280.631 bn
+24.456 bn
9.55%
1 ene 2006 año
299.012 bn
+18.38 bn
6.55%
1 ene 2007 año
317.8 bn
+18.789 bn
6.28%
1 ene 2008 año
353.917 bn
+36.116 bn
11.36%
1 ene 2009 año
367.584 bn
+13.667 bn
3.86%
1 ene 2010 año
330.913 bn
-36.671 bn
-9.98%
1 ene 2011 año
373.423 bn
+42.509 bn
12.85%
1 ene 2012 año
391.752 bn
+18.33 bn
4.91%
1 ene 2013 año
395.935 bn
+4.182 bn
1.07%
1 ene 2014 año
456.341 bn
+60.406 bn
15.26%
1 ene 2015 año
428.191 bn
-28.15 bn
-6.17%
1 ene 2016 año
438.245 bn
+10.053 bn
2.35%
Ranking de los países por los datos estadísticos actuales


Comentarios: