29
/es/
es
AIzaSyAYiBZKx7MnpbEhh9jyipgxe19OcubqV5w
April 1, 2024
69450
Argentina
ARG
true
2
1
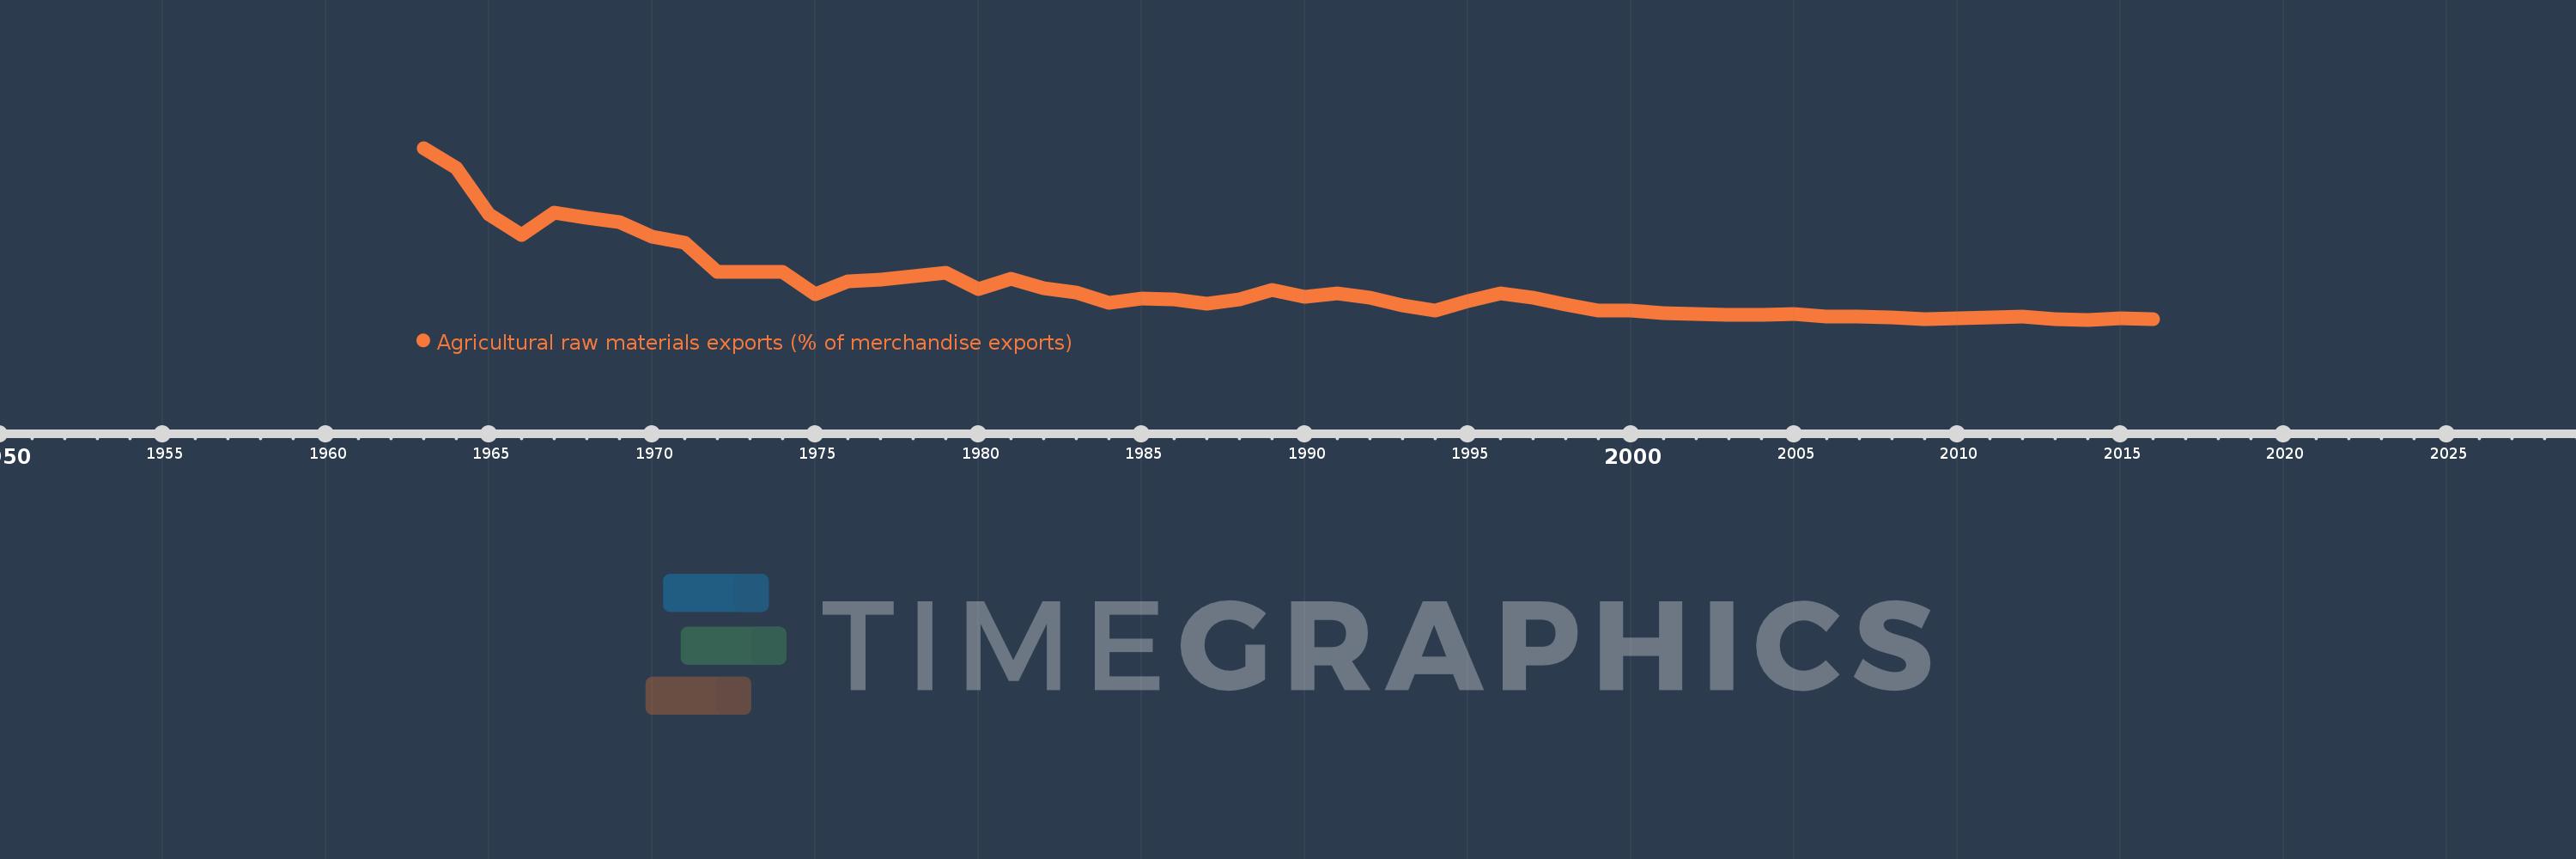
Agricultural raw materials exports (% of merchandise exports)
2016,2015,2014,2013,2012,2011,2010,2009,2008,2007,2006,2005,2004,2003,2002,2001,2000,1999,1998,1997,1996,1995,1994,1993,1992,1991,1990,1989,1988,1987,1986,1985,1984,1983,1982,1981,1980,1979,1978,1977,1976,1975,1974,1973,1972,1971,1970,1969,1968,1967,1966,1965,1964,1963
Estas estadísticas en otros países:
AfghanistanAlbaniaAlgeriaAndorraAngolaAntigua and BarbudaArab WorldArgentinaArmeniaArubaAustraliaAustriaAzerbaijanBahamas, TheBahrainBangladeshBarbadosBelarusBelgiumBelizeBeninBermudaBhutanBoliviaBosnia and HerzegovinaBotswanaBrazilBrunei DarussalamBulgariaBurkina FasoBurundiCabo VerdeCambodiaCameroonCanadaCaribbean small statesCayman IslandsCentral African RepublicCentral Europe and the BalticsChadChileChinaColombiaComorosCongo, Dem. Rep.Congo, Rep.Costa RicaCote d'IvoireCroatiaCubaCyprusCzech RepublicDenmarkDjiboutiDominicaDominican RepublicEarly-demographic dividendEast Asia & PacificEast Asia & Pacific (excluding high income)East Asia & Pacific (IDA & IBRD countries)EcuadorEgypt, Arab Rep.El SalvadorEquatorial GuineaEritreaEstoniaEthiopiaEuro areaEurope & Central AsiaEurope & Central Asia (excluding high income)Europe & Central Asia (IDA & IBRD countries)European UnionFaroe IslandsFijiFinlandFragile and conflict affected situationsFranceFrench PolynesiaGabonGambia, TheGeorgiaGermanyGhanaGreeceGreenlandGrenadaGuatemalaGuineaGuinea-BissauGuyanaHaitiHeavily indebted poor countries (HIPC)High incomeHondurasHong Kong SAR, ChinaHungaryIBRD onlyIcelandIDA & IBRD totalIDA blendIDA onlyIDA totalIndiaIndonesiaIran, Islamic Rep.IraqIrelandIsraelItalyJamaicaJapanJordanKazakhstanKenyaKiribatiKorea, Rep.KuwaitKyrgyz RepublicLao PDRLate-demographic dividendLatin America & Caribbean Latin America & Caribbean (excluding high income)Latin America & the Caribbean (IDA & IBRD countries)LatviaLeast developed countries: UN classificationLebanonLesothoLiberiaLibyaLithuaniaLow & middle incomeLower middle incomeLuxembourgMacao SAR, ChinaMacedonia, FYRMadagascarMalawiMalaysiaMaldivesMaliMaltaMauritaniaMauritiusMexicoMiddle East & North AfricaMiddle East & North Africa (excluding high income)Middle East & North Africa (IDA & IBRD countries)Middle incomeMoldovaMongoliaMoroccoMozambiqueMyanmarNamibiaNepalNetherlandsNew CaledoniaNew ZealandNicaraguaNigerNigeriaNorth AmericaNorwayOECD membersOmanOther small statesPacific island small statesPakistanPalauPanamaPapua New GuineaParaguayPeruPhilippinesPolandPortugalPost-demographic dividendPre-demographic dividendQatarRomaniaRussian FederationRwandaSamoaSao Tome and PrincipeSaudi ArabiaSenegalSerbiaSeychellesSierra LeoneSingaporeSlovak RepublicSloveniaSmall statesSolomon IslandsSomaliaSouth AfricaSouth AsiaSouth Asia (IDA & IBRD)SpainSri LankaSt. Kitts and NevisSt. LuciaSt. Vincent and the GrenadinesSub-Saharan Africa Sub-Saharan Africa (excluding high income)Sub-Saharan Africa (IDA & IBRD countries)SudanSurinameSwazilandSwedenSwitzerlandSyrian Arab RepublicTajikistanTanzaniaThailandTimor-LesteTogoTongaTrinidad and TobagoTunisiaTurkeyTurkmenistanTurks and Caicos IslandsTuvaluUgandaUkraineUnited Arab EmiratesUnited KingdomUnited StatesUpper middle incomeUruguayVanuatuVenezuela, RBVietnamVirgin Islands (U.S.)WorldYemen, Rep.ZambiaZimbabwe línea de tiempo (timeline):
En esta escala de tiempo se presenta un gráfico de 1963 y 2016 de Argentina. Los datos de 1962 están ausentes. El número de observaciones reales por fecha: 54.
Fuente (nombre):
Indicadores del desarrollo mundial
Fuente (organización):
World Bank staff estimates from the Comtrade database maintained by the United Nations Statistics Division.
Categorías:
Agriculture & Rural Development, Private Sector, Trade
Se ha actualizado:
23 abr 2017 año
Los indicadores de los cambios de valor en los últimos años
Mínimo:
0.927
1 ene 2014 año
Máximo:
23.088
1 ene 1963 año
A la fecha de observación
Valor
Cambio absoluto
El cambio con respecto al valor anterior
1 ene 1963 año
23.088
+23.088
0.0%
1 ene 1964 año
20.459
-2.629
-11.39%
1 ene 1965 año
14.517
-5.942
-29.05%
1 ene 1966 año
11.825
-2.692
-18.55%
1 ene 1967 año
14.702
+2.878
24.34%
1 ene 1968 año
14.04
-0.662
-4.5%
1 ene 1969 año
13.554
-0.487
-3.47%
1 ene 1970 año
11.587
-1.967
-14.51%
1 ene 1971 año
10.877
-0.709
-6.12%
1 ene 1972 año
7.136
-3.742
-34.4%
1 ene 1973 año
7.137
+0.002
0.02%
1 ene 1974 año
7.092
-0.045
-0.63%
1 ene 1975 año
4.252
-2.84
-40.05%
1 ene 1976 año
5.924
+1.672
39.31%
1 ene 1977 año
6.07
+0.146
2.47%
1 ene 1978 año
6.55
+0.48
7.9%
1 ene 1979 año
7.001
+0.451
6.89%
1 ene 1980 año
4.829
-2.172
-31.02%
1 ene 1981 año
6.231
+1.402
29.03%
1 ene 1982 año
4.96
-1.27
-20.39%
1 ene 1983 año
4.482
-0.478
-9.64%
1 ene 1984 año
3.093
-1.39
-31.0%
1 ene 1985 año
3.654
+0.561
18.13%
1 ene 1986 año
3.519
-0.135
-3.69%
1 ene 1987 año
2.971
-0.548
-15.57%
1 ene 1988 año
3.539
+0.568
19.12%
1 ene 1989 año
4.738
+1.199
33.89%
1 ene 1990 año
3.87
-0.868
-18.32%
1 ene 1991 año
4.314
+0.444
11.47%
1 ene 1992 año
3.777
-0.537
-12.45%
1 ene 1993 año
2.775
-1.002
-26.53%
1 ene 1994 año
2.106
-0.669
-24.1%
1 ene 1995 año
3.361
+1.255
59.57%
1 ene 1996 año
4.319
+0.958
28.51%
1 ene 1997 año
3.813
-0.506
-11.72%
1 ene 1998 año
2.843
-0.97
-25.44%
1 ene 1999 año
2.115
-0.728
-25.6%
1 ene 2000 año
2.1
-0.015
-0.69%
1 ene 2001 año
1.733
-0.367
-17.5%
1 ene 2002 año
1.618
-0.115
-6.62%
1 ene 2003 año
1.557
-0.061
-3.78%
1 ene 2004 año
1.522
-0.035
-2.23%
1 ene 2005 año
1.636
+0.114
7.46%
1 ene 2006 año
1.367
-0.269
-16.43%
1 ene 2007 año
1.288
-0.079
-5.76%
1 ene 2008 año
1.251
-0.038
-2.92%
1 ene 2009 año
0.985
-0.266
-21.27%
1 ene 2010 año
1.082
+0.097
9.86%
1 ene 2011 año
1.226
+0.144
13.29%
1 ene 2012 año
1.284
+0.058
4.77%
1 ene 2013 año
0.952
-0.332
-25.86%
1 ene 2014 año
0.927
-0.025
-2.61%
1 ene 2015 año
1.075
+0.148
15.91%
1 ene 2016 año
1.026
-0.049
-4.52%
Ranking de los países por los datos estadísticos actuales


Comentarios: