29
/es/
es
AIzaSyAYiBZKx7MnpbEhh9jyipgxe19OcubqV5w
April 1, 2024
187443
Malaysia
MYS
true
2
1
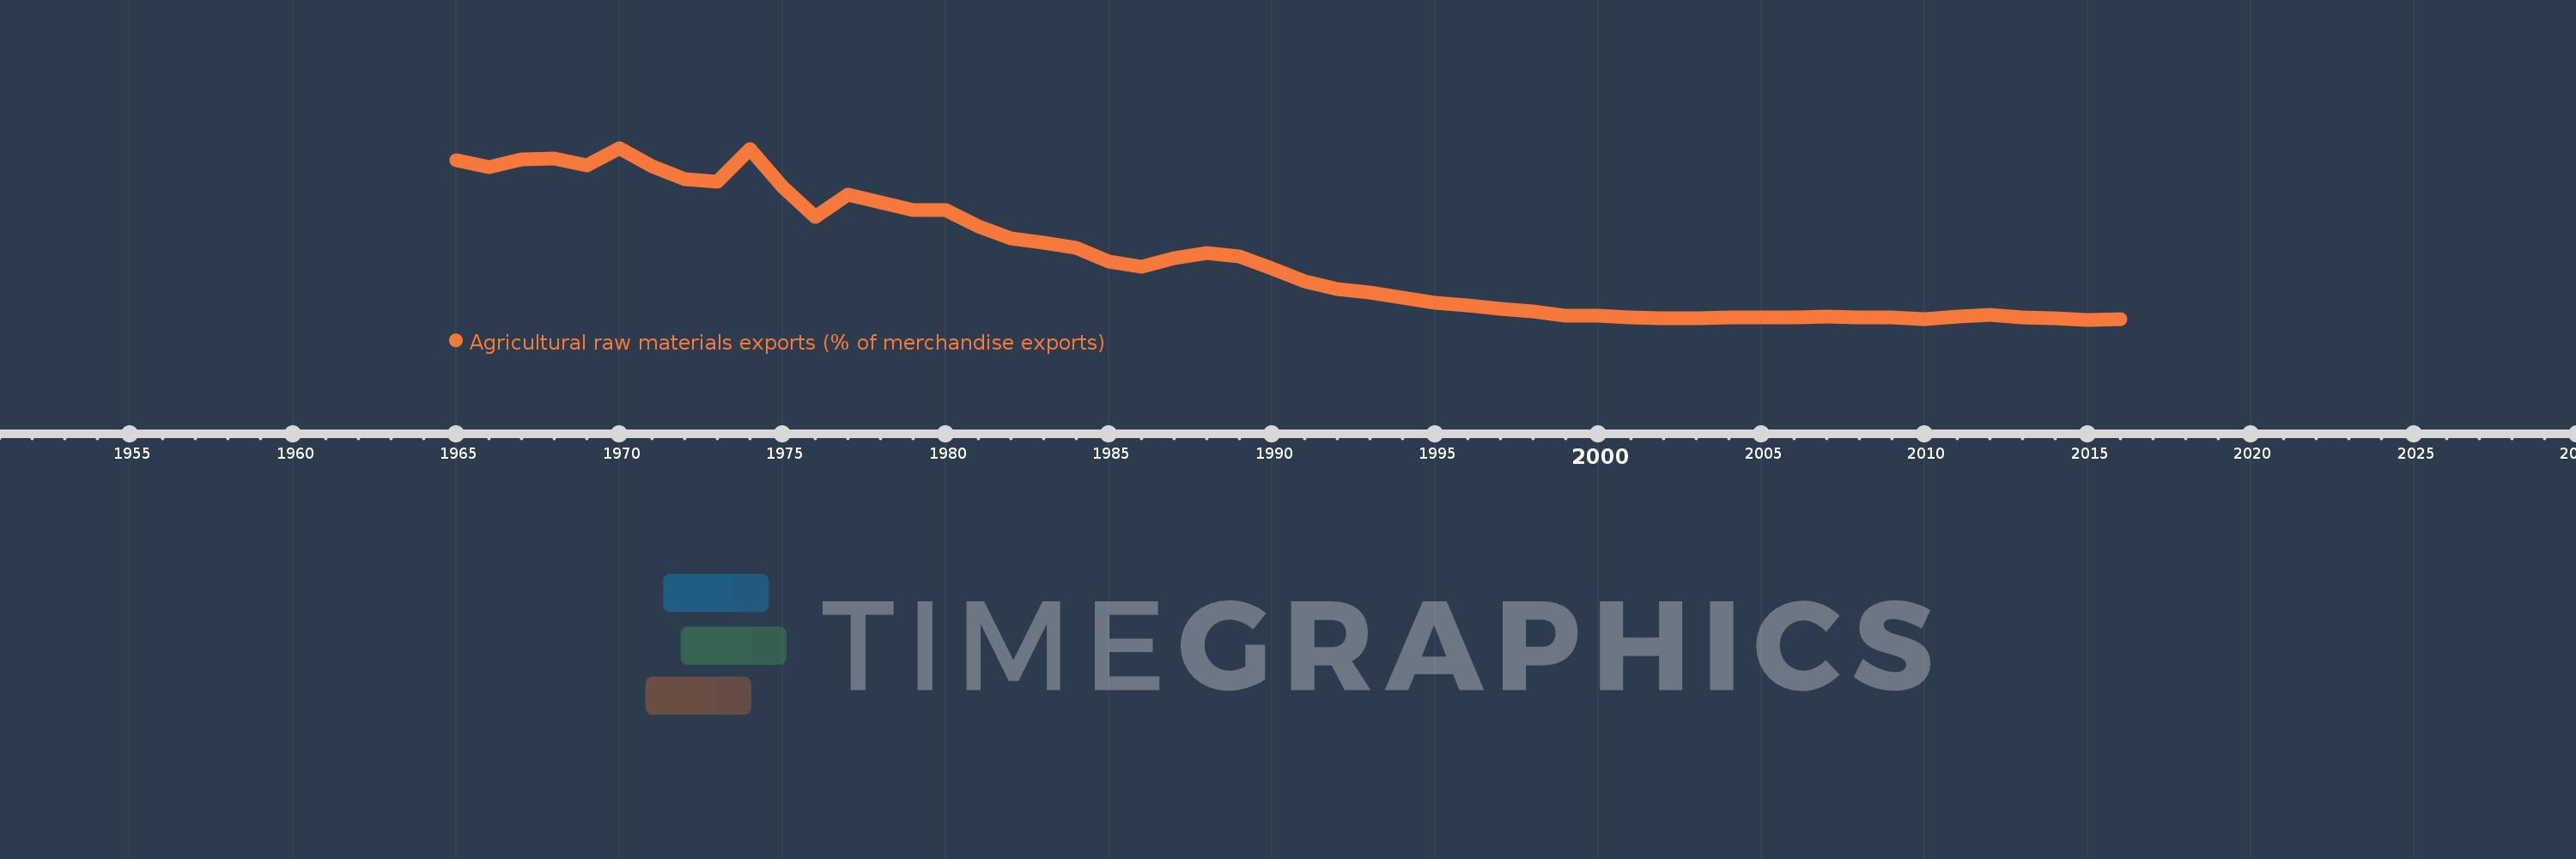
Agricultural raw materials exports (% of merchandise exports)
2016,2015,2014,2013,2012,2011,2010,2009,2008,2007,2006,2005,2004,2003,2002,2001,2000,1999,1998,1997,1996,1995,1994,1993,1992,1991,1990,1989,1988,1987,1986,1985,1984,1983,1982,1981,1980,1979,1978,1977,1976,1975,1974,1973,1972,1971,1970,1969,1968,1967,1966,1965
Estas estadísticas en otros países:
AfghanistanAlbaniaAlgeriaAndorraAngolaAntigua and BarbudaArab WorldArgentinaArmeniaArubaAustraliaAustriaAzerbaijanBahamas, TheBahrainBangladeshBarbadosBelarusBelgiumBelizeBeninBermudaBhutanBoliviaBosnia and HerzegovinaBotswanaBrazilBrunei DarussalamBulgariaBurkina FasoBurundiCabo VerdeCambodiaCameroonCanadaCaribbean small statesCayman IslandsCentral African RepublicCentral Europe and the BalticsChadChileChinaColombiaComorosCongo, Dem. Rep.Congo, Rep.Costa RicaCote d'IvoireCroatiaCubaCyprusCzech RepublicDenmarkDjiboutiDominicaDominican RepublicEarly-demographic dividendEast Asia & PacificEast Asia & Pacific (excluding high income)East Asia & Pacific (IDA & IBRD countries)EcuadorEgypt, Arab Rep.El SalvadorEquatorial GuineaEritreaEstoniaEthiopiaEuro areaEurope & Central AsiaEurope & Central Asia (excluding high income)Europe & Central Asia (IDA & IBRD countries)European UnionFaroe IslandsFijiFinlandFragile and conflict affected situationsFranceFrench PolynesiaGabonGambia, TheGeorgiaGermanyGhanaGreeceGreenlandGrenadaGuatemalaGuineaGuinea-BissauGuyanaHaitiHeavily indebted poor countries (HIPC)High incomeHondurasHong Kong SAR, ChinaHungaryIBRD onlyIcelandIDA & IBRD totalIDA blendIDA onlyIDA totalIndiaIndonesiaIran, Islamic Rep.IraqIrelandIsraelItalyJamaicaJapanJordanKazakhstanKenyaKiribatiKorea, Rep.KuwaitKyrgyz RepublicLao PDRLate-demographic dividendLatin America & Caribbean Latin America & Caribbean (excluding high income)Latin America & the Caribbean (IDA & IBRD countries)LatviaLeast developed countries: UN classificationLebanonLesothoLiberiaLibyaLithuaniaLow & middle incomeLower middle incomeLuxembourgMacao SAR, ChinaMacedonia, FYRMadagascarMalawiMalaysiaMaldivesMaliMaltaMauritaniaMauritiusMexicoMiddle East & North AfricaMiddle East & North Africa (excluding high income)Middle East & North Africa (IDA & IBRD countries)Middle incomeMoldovaMongoliaMoroccoMozambiqueMyanmarNamibiaNepalNetherlandsNew CaledoniaNew ZealandNicaraguaNigerNigeriaNorth AmericaNorwayOECD membersOmanOther small statesPacific island small statesPakistanPalauPanamaPapua New GuineaParaguayPeruPhilippinesPolandPortugalPost-demographic dividendPre-demographic dividendQatarRomaniaRussian FederationRwandaSamoaSao Tome and PrincipeSaudi ArabiaSenegalSerbiaSeychellesSierra LeoneSingaporeSlovak RepublicSloveniaSmall statesSolomon IslandsSomaliaSouth AfricaSouth AsiaSouth Asia (IDA & IBRD)SpainSri LankaSt. Kitts and NevisSt. LuciaSt. Vincent and the GrenadinesSub-Saharan Africa Sub-Saharan Africa (excluding high income)Sub-Saharan Africa (IDA & IBRD countries)SudanSurinameSwazilandSwedenSwitzerlandSyrian Arab RepublicTajikistanTanzaniaThailandTimor-LesteTogoTongaTrinidad and TobagoTunisiaTurkeyTurkmenistanTurks and Caicos IslandsTuvaluUgandaUkraineUnited Arab EmiratesUnited KingdomUnited StatesUpper middle incomeUruguayVanuatuVenezuela, RBVietnamVirgin Islands (U.S.)WorldYemen, Rep.ZambiaZimbabwe línea de tiempo (timeline):
En esta escala de tiempo se presenta un gráfico de 1965 y 2016 de Malaysia. Los datos de 1964 están ausentes. El número de observaciones reales por fecha: 52.
Fuente (nombre):
Indicadores del desarrollo mundial
Fuente (organización):
World Bank staff estimates from the Comtrade database maintained by the United Nations Statistics Division.
Categorías:
Agriculture & Rural Development, Private Sector, Trade
Se ha actualizado:
23 abr 2017 año
Los indicadores de los cambios de valor en los últimos años
Mínimo:
1.749
1 ene 2015 año
Máximo:
55.711
1 ene 1970 año
A la fecha de observación
Valor
Cambio absoluto
El cambio con respecto al valor anterior
1 ene 1965 año
51.828
+51.828
0.0%
1 ene 1966 año
49.666
-2.162
-4.17%
1 ene 1967 año
52.188
+2.522
5.08%
1 ene 1968 año
52.29
+0.102
0.19%
1 ene 1969 año
50.142
-2.148
-4.11%
1 ene 1970 año
55.711
+5.57
11.11%
1 ene 1971 año
50.048
-5.663
-10.16%
1 ene 1972 año
46.006
-4.042
-8.08%
1 ene 1973 año
45.071
-0.935
-2.03%
1 ene 1974 año
55.352
+10.281
22.81%
1 ene 1975 año
43.577
-11.775
-21.27%
1 ene 1976 año
34.127
-9.45
-21.69%
1 ene 1977 año
41.067
+6.94
20.34%
1 ene 1978 año
38.698
-2.369
-5.77%
1 ene 1979 año
36.288
-2.41
-6.23%
1 ene 1980 año
36.181
-0.107
-0.29%
1 ene 1981 año
31.001
-5.18
-14.32%
1 ene 1982 año
27.39
-3.611
-11.65%
1 ene 1983 año
26.017
-1.374
-5.01%
1 ene 1984 año
24.263
-1.754
-6.74%
1 ene 1985 año
20.146
-4.117
-16.97%
1 ene 1986 año
18.376
-1.769
-8.78%
1 ene 1987 año
21.1
+2.724
14.82%
1 ene 1988 año
22.635
+1.535
7.28%
1 ene 1989 año
21.542
-1.094
-4.83%
1 ene 1990 año
17.899
-3.643
-16.91%
1 ene 1991 año
13.804
-4.094
-22.88%
1 ene 1992 año
11.28
-2.524
-18.29%
1 ene 1993 año
10.239
-1.041
-9.23%
1 ene 1994 año
8.749
-1.49
-14.55%
1 ene 1995 año
7.16
-1.589
-18.16%
1 ene 1996 año
6.184
-0.976
-13.63%
1 ene 1997 año
5.207
-0.977
-15.8%
1 ene 1998 año
4.353
-0.854
-16.4%
1 ene 1999 año
3.05
-1.303
-29.93%
1 ene 2000 año
2.908
-0.142
-4.67%
1 ene 2001 año
2.61
-0.297
-10.22%
1 ene 2002 año
2.106
-0.504
-19.31%
1 ene 2003 año
2.223
+0.117
5.55%
1 ene 2004 año
2.397
+0.174
7.81%
1 ene 2005 año
2.446
+0.049
2.03%
1 ene 2006 año
2.467
+0.022
0.89%
1 ene 2007 año
2.732
+0.264
10.71%
1 ene 2008 año
2.454
-0.278
-10.16%
1 ene 2009 año
2.347
-0.107
-4.35%
1 ene 2010 año
2.049
-0.298
-12.7%
1 ene 2011 año
2.641
+0.592
28.9%
1 ene 2012 año
3.16
+0.519
19.65%
1 ene 2013 año
2.396
-0.764
-24.17%
1 ene 2014 año
2.152
-0.244
-10.2%
1 ene 2015 año
1.749
-0.403
-18.71%
1 ene 2016 año
1.835
+0.086
4.9%
Ranking de los países por los datos estadísticos actuales


Comentarios: