29
/es/
es
AIzaSyAYiBZKx7MnpbEhh9jyipgxe19OcubqV5w
April 1, 2024
61339
Upper middle income
UMC
false
2
1
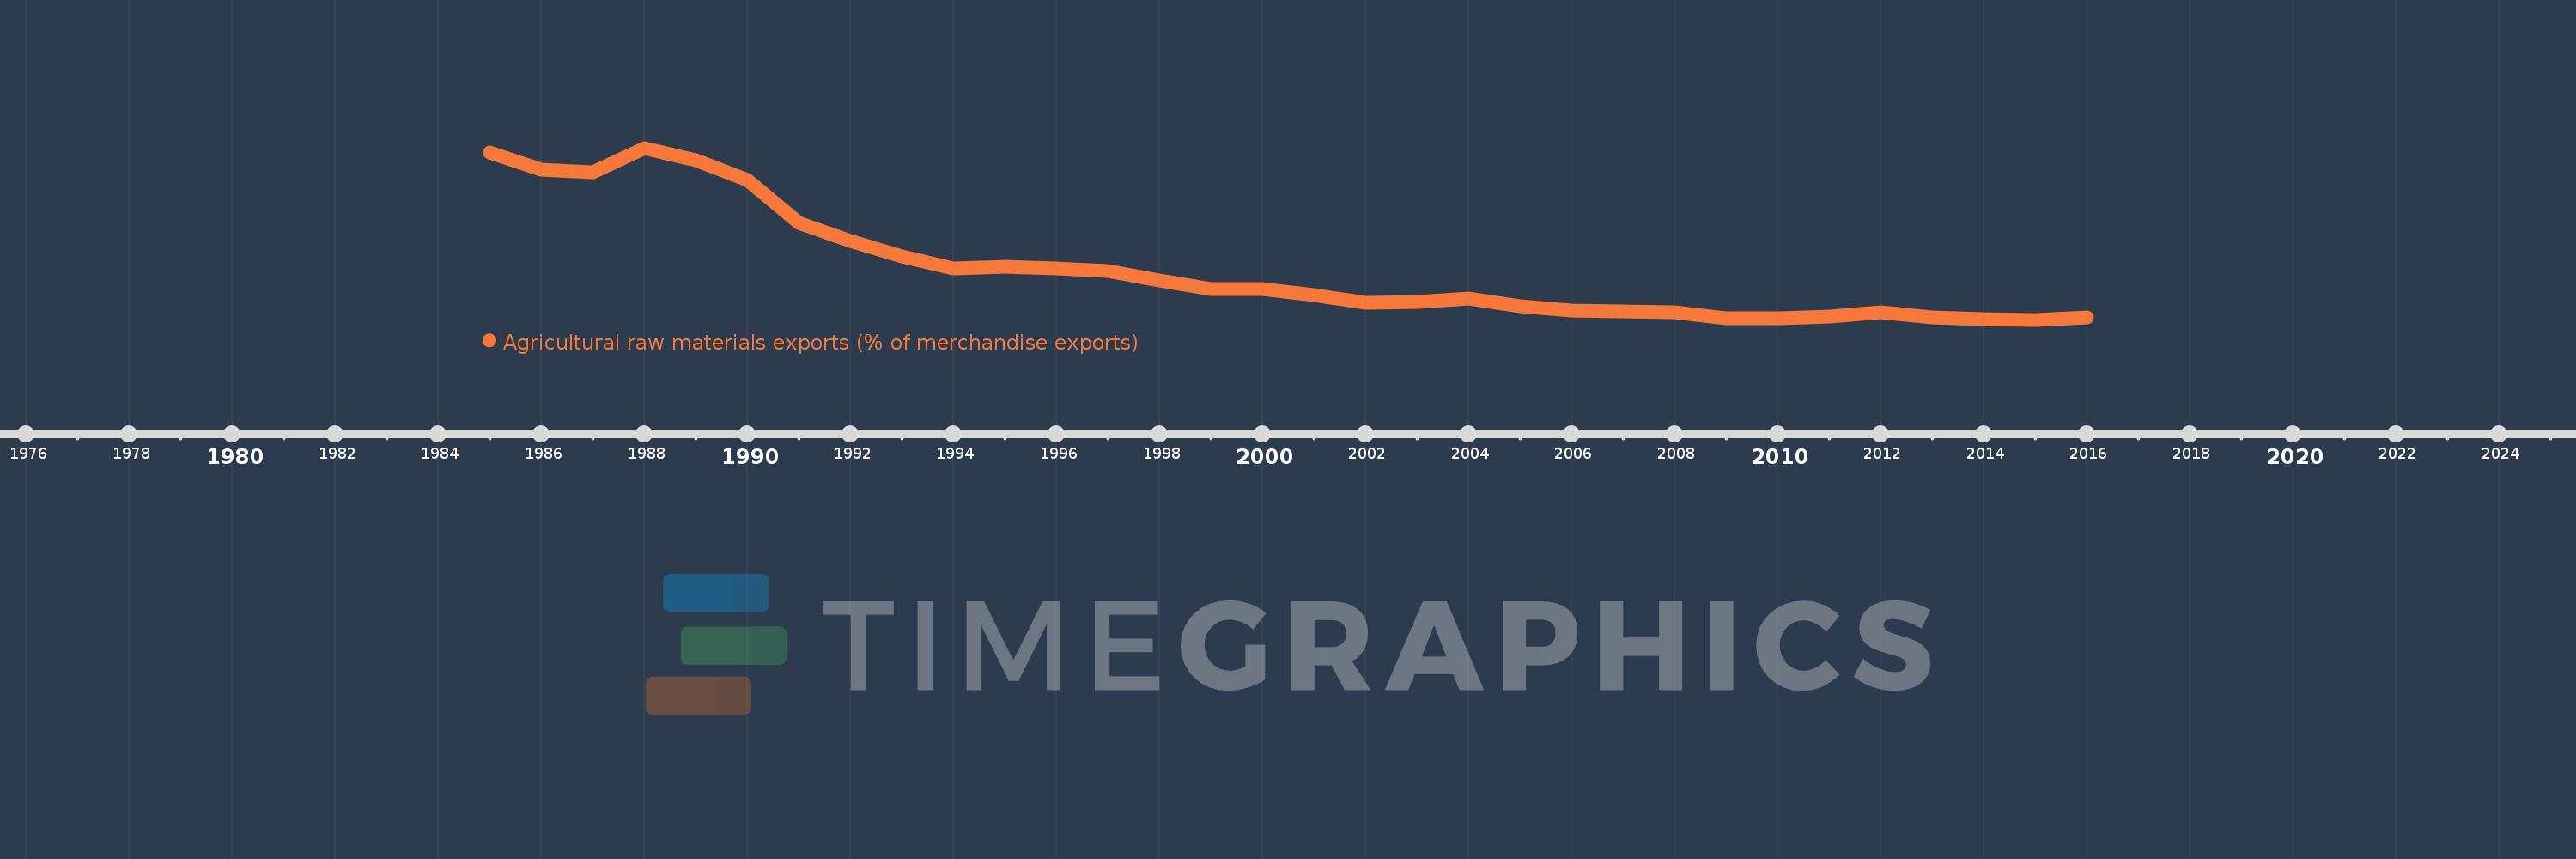
Agricultural raw materials exports (% of merchandise exports)
2016,2015,2014,2013,2012,2011,2010,2009,2008,2007,2006,2005,2004,2003,2002,2001,2000,1999,1998,1997,1996,1995,1994,1993,1992,1991,1990,1989,1988,1987,1986,1985
Estas estadísticas en otros países:
AfghanistanAlbaniaAlgeriaAndorraAngolaAntigua and BarbudaArab WorldArgentinaArmeniaArubaAustraliaAustriaAzerbaijanBahamas, TheBahrainBangladeshBarbadosBelarusBelgiumBelizeBeninBermudaBhutanBoliviaBosnia and HerzegovinaBotswanaBrazilBrunei DarussalamBulgariaBurkina FasoBurundiCabo VerdeCambodiaCameroonCanadaCaribbean small statesCayman IslandsCentral African RepublicCentral Europe and the BalticsChadChileChinaColombiaComorosCongo, Dem. Rep.Congo, Rep.Costa RicaCote d'IvoireCroatiaCubaCyprusCzech RepublicDenmarkDjiboutiDominicaDominican RepublicEarly-demographic dividendEast Asia & PacificEast Asia & Pacific (excluding high income)East Asia & Pacific (IDA & IBRD countries)EcuadorEgypt, Arab Rep.El SalvadorEquatorial GuineaEritreaEstoniaEthiopiaEuro areaEurope & Central AsiaEurope & Central Asia (excluding high income)Europe & Central Asia (IDA & IBRD countries)European UnionFaroe IslandsFijiFinlandFragile and conflict affected situationsFranceFrench PolynesiaGabonGambia, TheGeorgiaGermanyGhanaGreeceGreenlandGrenadaGuatemalaGuineaGuinea-BissauGuyanaHaitiHeavily indebted poor countries (HIPC)High incomeHondurasHong Kong SAR, ChinaHungaryIBRD onlyIcelandIDA & IBRD totalIDA blendIDA onlyIDA totalIndiaIndonesiaIran, Islamic Rep.IraqIrelandIsraelItalyJamaicaJapanJordanKazakhstanKenyaKiribatiKorea, Rep.KuwaitKyrgyz RepublicLao PDRLate-demographic dividendLatin America & Caribbean Latin America & Caribbean (excluding high income)Latin America & the Caribbean (IDA & IBRD countries)LatviaLeast developed countries: UN classificationLebanonLesothoLiberiaLibyaLithuaniaLow & middle incomeLower middle incomeLuxembourgMacao SAR, ChinaMacedonia, FYRMadagascarMalawiMalaysiaMaldivesMaliMaltaMauritaniaMauritiusMexicoMiddle East & North AfricaMiddle East & North Africa (excluding high income)Middle East & North Africa (IDA & IBRD countries)Middle incomeMoldovaMongoliaMoroccoMozambiqueMyanmarNamibiaNepalNetherlandsNew CaledoniaNew ZealandNicaraguaNigerNigeriaNorth AmericaNorwayOECD membersOmanOther small statesPacific island small statesPakistanPalauPanamaPapua New GuineaParaguayPeruPhilippinesPolandPortugalPost-demographic dividendPre-demographic dividendQatarRomaniaRussian FederationRwandaSamoaSao Tome and PrincipeSaudi ArabiaSenegalSerbiaSeychellesSierra LeoneSingaporeSlovak RepublicSloveniaSmall statesSolomon IslandsSomaliaSouth AfricaSouth AsiaSouth Asia (IDA & IBRD)SpainSri LankaSt. Kitts and NevisSt. LuciaSt. Vincent and the GrenadinesSub-Saharan Africa Sub-Saharan Africa (excluding high income)Sub-Saharan Africa (IDA & IBRD countries)SudanSurinameSwazilandSwedenSwitzerlandSyrian Arab RepublicTajikistanTanzaniaThailandTimor-LesteTogoTongaTrinidad and TobagoTunisiaTurkeyTurkmenistanTurks and Caicos IslandsTuvaluUgandaUkraineUnited Arab EmiratesUnited KingdomUnited StatesUpper middle incomeUruguayVanuatuVenezuela, RBVietnamVirgin Islands (U.S.)WorldYemen, Rep.ZambiaZimbabwe línea de tiempo (timeline):
En esta escala de tiempo se presenta un gráfico de 1985 y 2016 de Upper middle income. Los datos de 1984 están ausentes. El número de observaciones reales por fecha: 32.
Fuente (nombre):
Indicadores del desarrollo mundial
Fuente (organización):
World Bank staff estimates from the Comtrade database maintained by the United Nations Statistics Division.
Categorías:
Agriculture & Rural Development, Private Sector, Trade
Se ha actualizado:
23 abr 2017 año
Los indicadores de los cambios de valor en los últimos años
Mínimo:
1.183
1 ene 2015 año
Máximo:
6.053
1 ene 1988 año
A la fecha de observación
Valor
Cambio absoluto
El cambio con respecto al valor anterior
1 ene 1985 año
5.934
+5.934
0.0%
1 ene 1986 año
5.435
-0.5
-8.42%
1 ene 1987 año
5.358
-0.076
-1.41%
1 ene 1988 año
6.053
+0.694
12.96%
1 ene 1989 año
5.715
-0.338
-5.58%
1 ene 1990 año
5.134
-0.58
-10.16%
1 ene 1991 año
3.931
-1.203
-23.43%
1 ene 1992 año
3.404
-0.527
-13.41%
1 ene 1993 año
2.981
-0.423
-12.43%
1 ene 1994 año
2.645
-0.336
-11.27%
1 ene 1995 año
2.697
+0.052
1.95%
1 ene 1996 año
2.647
-0.049
-1.83%
1 ene 1997 año
2.56
-0.087
-3.3%
1 ene 1998 año
2.3
-0.26
-10.15%
1 ene 1999 año
2.048
-0.253
-10.98%
1 ene 2000 año
2.058
+0.01
0.51%
1 ene 2001 año
1.893
-0.165
-8.01%
1 ene 2002 año
1.668
-0.226
-11.92%
1 ene 2003 año
1.681
+0.013
0.8%
1 ene 2004 año
1.787
+0.106
6.32%
1 ene 2005 año
1.556
-0.232
-12.95%
1 ene 2006 año
1.449
-0.107
-6.87%
1 ene 2007 año
1.421
-0.027
-1.89%
1 ene 2008 año
1.397
-0.024
-1.72%
1 ene 2009 año
1.232
-0.164
-11.77%
1 ene 2010 año
1.217
-0.015
-1.23%
1 ene 2011 año
1.285
+0.068
5.62%
1 ene 2012 año
1.4
+0.114
8.88%
1 ene 2013 año
1.245
-0.155
-11.07%
1 ene 2014 año
1.196
-0.049
-3.92%
1 ene 2015 año
1.183
-0.013
-1.08%
1 ene 2016 año
1.26
+0.077
6.48%
Ranking de los países por los datos estadísticos actuales


Comentarios: