29
/es/
es
AIzaSyAYiBZKx7MnpbEhh9jyipgxe19OcubqV5w
April 1, 2024
159138
Ireland
IRL
true
2
1
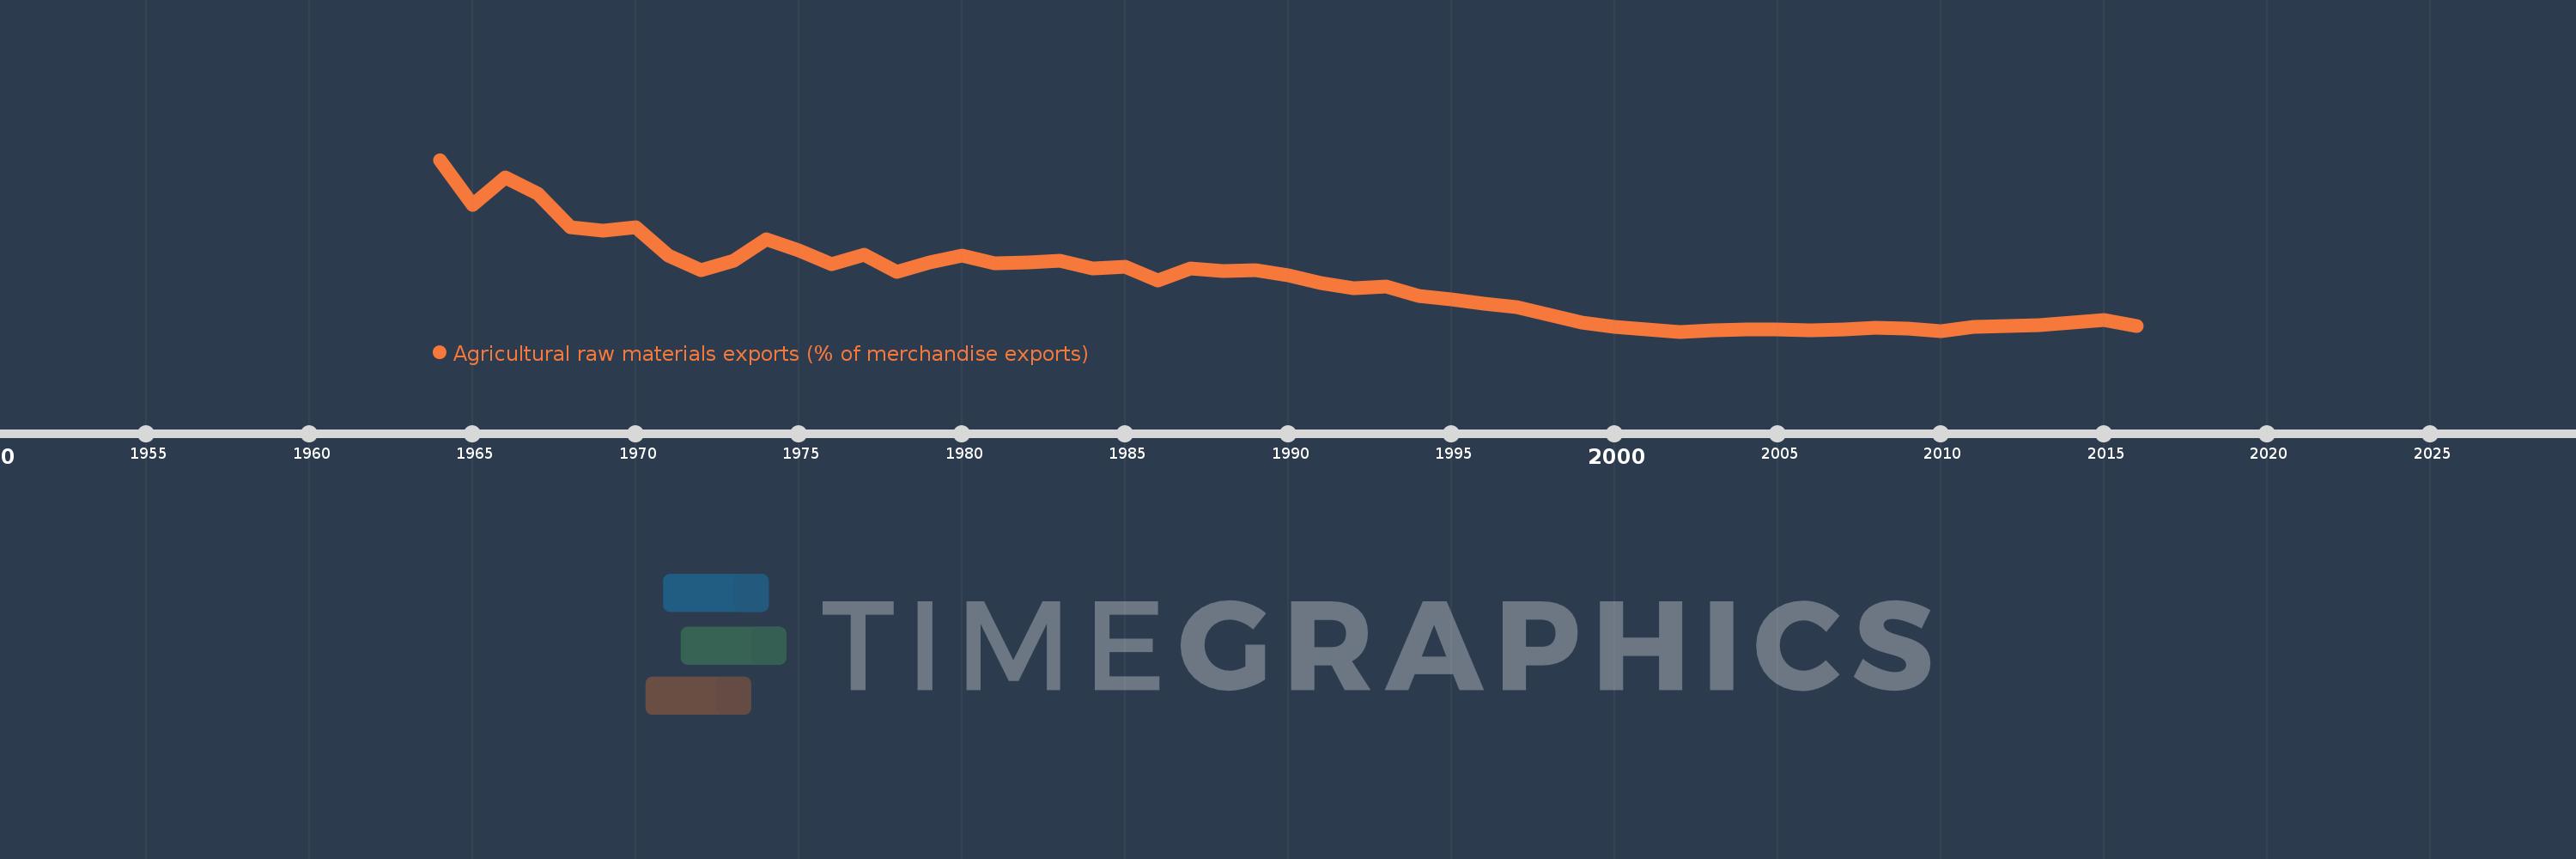
Agricultural raw materials exports (% of merchandise exports)
2016,2015,2014,2013,2012,2011,2010,2009,2008,2007,2006,2005,2004,2003,2002,2001,2000,1999,1998,1997,1996,1995,1994,1993,1992,1991,1990,1989,1988,1987,1986,1985,1984,1983,1982,1981,1980,1979,1978,1977,1976,1975,1974,1973,1972,1971,1970,1969,1968,1967,1966,1965,1964
Estas estadísticas en otros países:
AfghanistanAlbaniaAlgeriaAndorraAngolaAntigua and BarbudaArab WorldArgentinaArmeniaArubaAustraliaAustriaAzerbaijanBahamas, TheBahrainBangladeshBarbadosBelarusBelgiumBelizeBeninBermudaBhutanBoliviaBosnia and HerzegovinaBotswanaBrazilBrunei DarussalamBulgariaBurkina FasoBurundiCabo VerdeCambodiaCameroonCanadaCaribbean small statesCayman IslandsCentral African RepublicCentral Europe and the BalticsChadChileChinaColombiaComorosCongo, Dem. Rep.Congo, Rep.Costa RicaCote d'IvoireCroatiaCubaCyprusCzech RepublicDenmarkDjiboutiDominicaDominican RepublicEarly-demographic dividendEast Asia & PacificEast Asia & Pacific (excluding high income)East Asia & Pacific (IDA & IBRD countries)EcuadorEgypt, Arab Rep.El SalvadorEquatorial GuineaEritreaEstoniaEthiopiaEuro areaEurope & Central AsiaEurope & Central Asia (excluding high income)Europe & Central Asia (IDA & IBRD countries)European UnionFaroe IslandsFijiFinlandFragile and conflict affected situationsFranceFrench PolynesiaGabonGambia, TheGeorgiaGermanyGhanaGreeceGreenlandGrenadaGuatemalaGuineaGuinea-BissauGuyanaHaitiHeavily indebted poor countries (HIPC)High incomeHondurasHong Kong SAR, ChinaHungaryIBRD onlyIcelandIDA & IBRD totalIDA blendIDA onlyIDA totalIndiaIndonesiaIran, Islamic Rep.IraqIrelandIsraelItalyJamaicaJapanJordanKazakhstanKenyaKiribatiKorea, Rep.KuwaitKyrgyz RepublicLao PDRLate-demographic dividendLatin America & Caribbean Latin America & Caribbean (excluding high income)Latin America & the Caribbean (IDA & IBRD countries)LatviaLeast developed countries: UN classificationLebanonLesothoLiberiaLibyaLithuaniaLow & middle incomeLower middle incomeLuxembourgMacao SAR, ChinaMacedonia, FYRMadagascarMalawiMalaysiaMaldivesMaliMaltaMauritaniaMauritiusMexicoMiddle East & North AfricaMiddle East & North Africa (excluding high income)Middle East & North Africa (IDA & IBRD countries)Middle incomeMoldovaMongoliaMoroccoMozambiqueMyanmarNamibiaNepalNetherlandsNew CaledoniaNew ZealandNicaraguaNigerNigeriaNorth AmericaNorwayOECD membersOmanOther small statesPacific island small statesPakistanPalauPanamaPapua New GuineaParaguayPeruPhilippinesPolandPortugalPost-demographic dividendPre-demographic dividendQatarRomaniaRussian FederationRwandaSamoaSao Tome and PrincipeSaudi ArabiaSenegalSerbiaSeychellesSierra LeoneSingaporeSlovak RepublicSloveniaSmall statesSolomon IslandsSomaliaSouth AfricaSouth AsiaSouth Asia (IDA & IBRD)SpainSri LankaSt. Kitts and NevisSt. LuciaSt. Vincent and the GrenadinesSub-Saharan Africa Sub-Saharan Africa (excluding high income)Sub-Saharan Africa (IDA & IBRD countries)SudanSurinameSwazilandSwedenSwitzerlandSyrian Arab RepublicTajikistanTanzaniaThailandTimor-LesteTogoTongaTrinidad and TobagoTunisiaTurkeyTurkmenistanTurks and Caicos IslandsTuvaluUgandaUkraineUnited Arab EmiratesUnited KingdomUnited StatesUpper middle incomeUruguayVanuatuVenezuela, RBVietnamVirgin Islands (U.S.)WorldYemen, Rep.ZambiaZimbabwe línea de tiempo (timeline):
En esta escala de tiempo se presenta un gráfico de 1964 y 2016 de Ireland. Los datos de 1963 están ausentes. El número de observaciones reales por fecha: 53.
Fuente (nombre):
Indicadores del desarrollo mundial
Fuente (organización):
World Bank staff estimates from the Comtrade database maintained by the United Nations Statistics Division.
Categorías:
Agriculture & Rural Development, Private Sector, Trade
Se ha actualizado:
23 abr 2017 año
Los indicadores de los cambios de valor en los últimos años
Mínimo:
0.418
1 ene 2002 año
Máximo:
4.733
1 ene 1964 año
A la fecha de observación
Valor
Cambio absoluto
El cambio con respecto al valor anterior
1 ene 1964 año
4.733
+4.733
0.0%
1 ene 1965 año
3.599
-1.134
-23.97%
1 ene 1966 año
4.281
+0.683
18.97%
1 ene 1967 año
3.874
-0.408
-9.52%
1 ene 1968 año
3.03
-0.844
-21.79%
1 ene 1969 año
2.956
-0.074
-2.43%
1 ene 1970 año
3.029
+0.073
2.47%
1 ene 1971 año
2.325
-0.703
-23.23%
1 ene 1972 año
1.962
-0.364
-15.65%
1 ene 1973 año
2.189
+0.227
11.6%
1 ene 1974 año
2.729
+0.54
24.66%
1 ene 1975 año
2.463
-0.266
-9.73%
1 ene 1976 año
2.11
-0.353
-14.34%
1 ene 1977 año
2.357
+0.247
11.7%
1 ene 1978 año
1.915
-0.442
-18.74%
1 ene 1979 año
2.163
+0.248
12.96%
1 ene 1980 año
2.336
+0.173
7.99%
1 ene 1981 año
2.134
-0.202
-8.67%
1 ene 1982 año
2.151
+0.017
0.8%
1 ene 1983 año
2.192
+0.041
1.91%
1 ene 1984 año
2.013
-0.179
-8.18%
1 ene 1985 año
2.044
+0.032
1.57%
1 ene 1986 año
1.691
-0.353
-17.27%
1 ene 1987 año
2.003
+0.312
18.46%
1 ene 1988 año
1.939
-0.065
-3.23%
1 ene 1989 año
1.966
+0.028
1.42%
1 ene 1990 año
1.824
-0.142
-7.24%
1 ene 1991 año
1.638
-0.186
-10.2%
1 ene 1992 año
1.5
-0.138
-8.42%
1 ene 1993 año
1.543
+0.044
2.9%
1 ene 1994 año
1.323
-0.221
-14.29%
1 ene 1995 año
1.223
-0.099
-7.52%
1 ene 1996 año
1.115
-0.109
-8.89%
1 ene 1997 año
1.037
-0.078
-6.97%
1 ene 1998 año
0.842
-0.195
-18.77%
1 ene 1999 año
0.635
-0.207
-24.6%
1 ene 2000 año
0.535
-0.1
-15.81%
1 ene 2001 año
0.471
-0.063
-11.87%
1 ene 2002 año
0.418
-0.053
-11.24%
1 ene 2003 año
0.44
+0.022
5.28%
1 ene 2004 año
0.468
+0.027
6.22%
1 ene 2005 año
0.473
+0.005
1.06%
1 ene 2006 año
0.447
-0.025
-5.37%
1 ene 2007 año
0.463
+0.016
3.48%
1 ene 2008 año
0.52
+0.058
12.44%
1 ene 2009 año
0.484
-0.036
-6.95%
1 ene 2010 año
0.426
-0.058
-11.95%
1 ene 2011 año
0.527
+0.101
23.69%
1 ene 2012 año
0.559
+0.032
6.08%
1 ene 2013 año
0.573
+0.014
2.51%
1 ene 2014 año
0.646
+0.072
12.6%
1 ene 2015 año
0.702
+0.056
8.68%
1 ene 2016 año
0.564
-0.138
-19.62%
Ranking de los países por los datos estadísticos actuales


Comentarios: