29
/es/
es
AIzaSyAYiBZKx7MnpbEhh9jyipgxe19OcubqV5w
April 1, 2024
52398
OECD members
OED
false
2
1
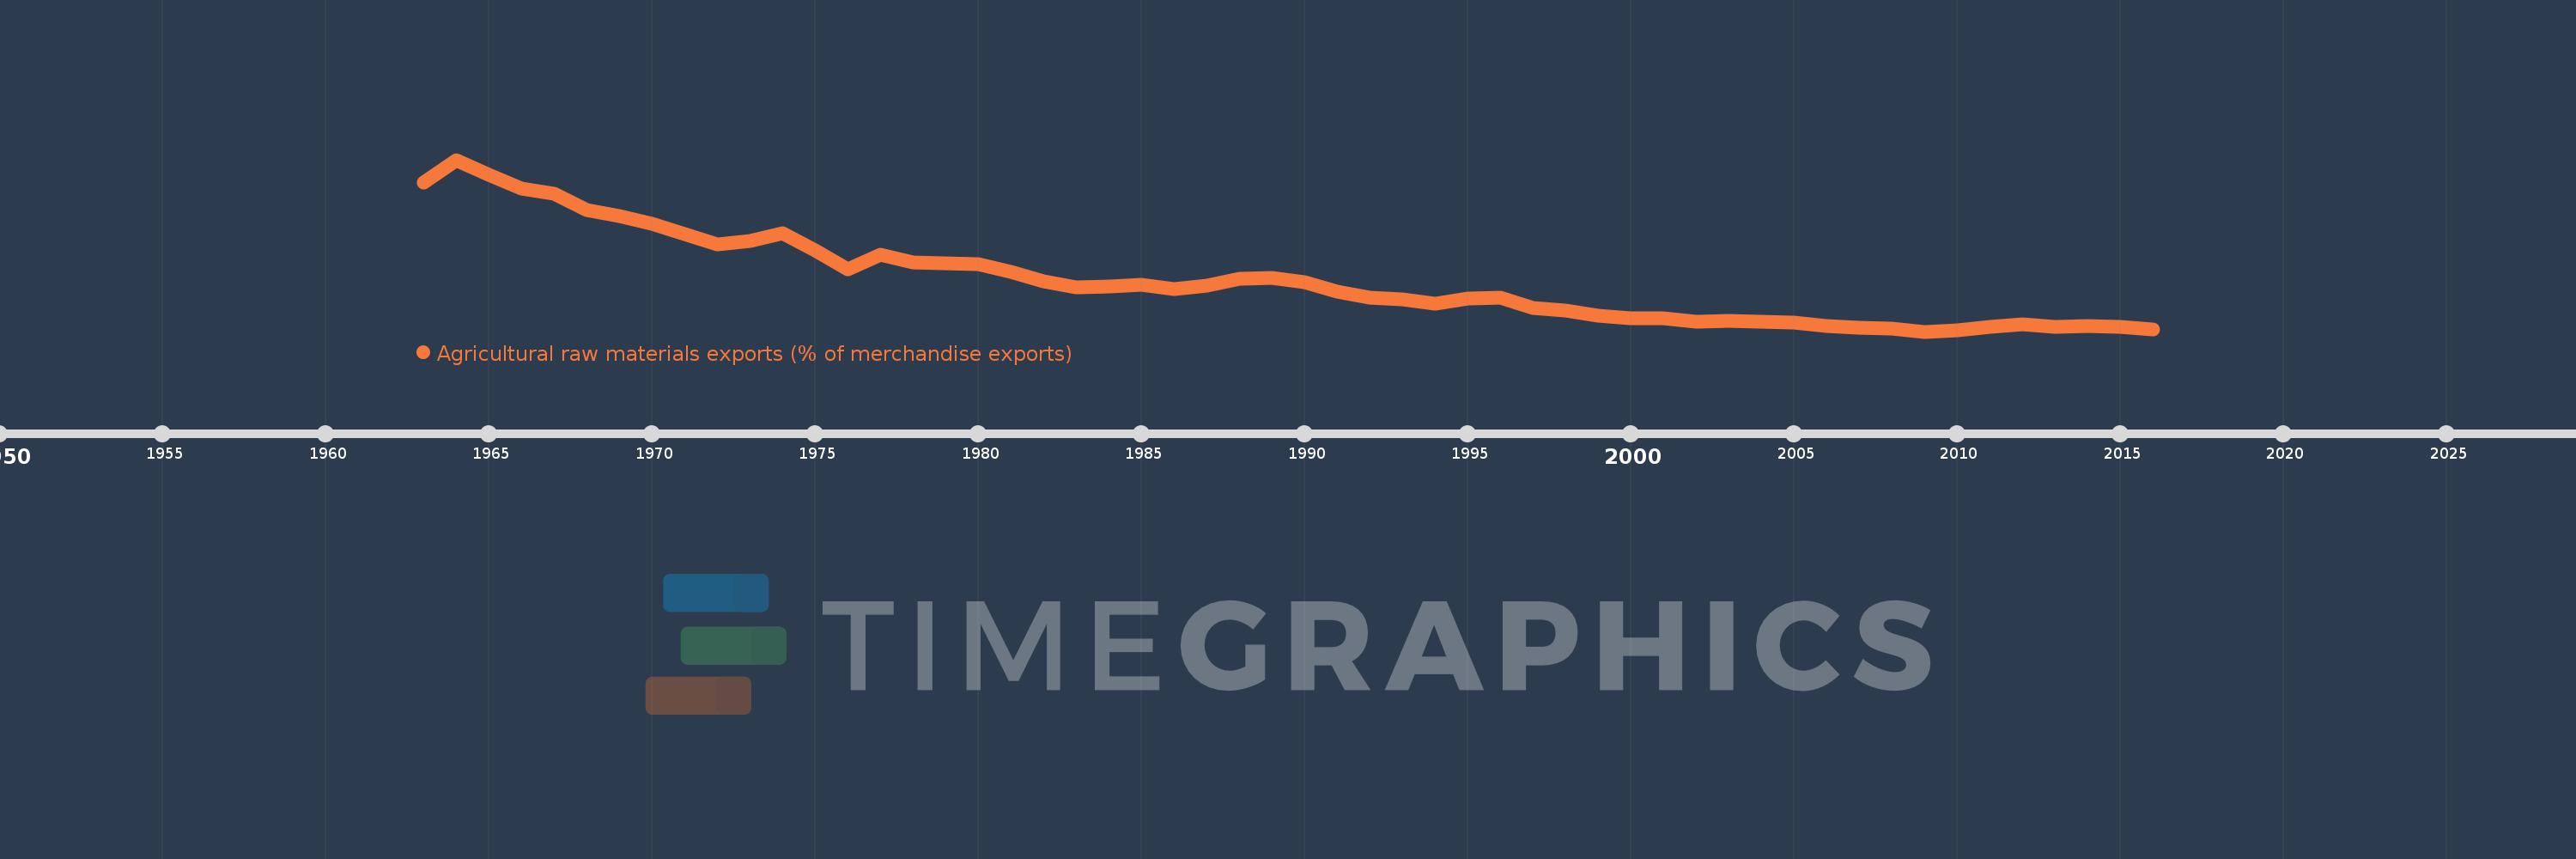
Agricultural raw materials exports (% of merchandise exports)
2016,2015,2014,2013,2012,2011,2010,2009,2008,2007,2006,2005,2004,2003,2002,2001,2000,1999,1998,1997,1996,1995,1994,1993,1992,1991,1990,1989,1988,1987,1986,1985,1984,1983,1982,1981,1980,1979,1978,1977,1976,1975,1974,1973,1972,1971,1970,1969,1968,1967,1966,1965,1964,1963
Estas estadísticas en otros países:
AfghanistanAlbaniaAlgeriaAndorraAngolaAntigua and BarbudaArab WorldArgentinaArmeniaArubaAustraliaAustriaAzerbaijanBahamas, TheBahrainBangladeshBarbadosBelarusBelgiumBelizeBeninBermudaBhutanBoliviaBosnia and HerzegovinaBotswanaBrazilBrunei DarussalamBulgariaBurkina FasoBurundiCabo VerdeCambodiaCameroonCanadaCaribbean small statesCayman IslandsCentral African RepublicCentral Europe and the BalticsChadChileChinaColombiaComorosCongo, Dem. Rep.Congo, Rep.Costa RicaCote d'IvoireCroatiaCubaCyprusCzech RepublicDenmarkDjiboutiDominicaDominican RepublicEarly-demographic dividendEast Asia & PacificEast Asia & Pacific (excluding high income)East Asia & Pacific (IDA & IBRD countries)EcuadorEgypt, Arab Rep.El SalvadorEquatorial GuineaEritreaEstoniaEthiopiaEuro areaEurope & Central AsiaEurope & Central Asia (excluding high income)Europe & Central Asia (IDA & IBRD countries)European UnionFaroe IslandsFijiFinlandFragile and conflict affected situationsFranceFrench PolynesiaGabonGambia, TheGeorgiaGermanyGhanaGreeceGreenlandGrenadaGuatemalaGuineaGuinea-BissauGuyanaHaitiHeavily indebted poor countries (HIPC)High incomeHondurasHong Kong SAR, ChinaHungaryIBRD onlyIcelandIDA & IBRD totalIDA blendIDA onlyIDA totalIndiaIndonesiaIran, Islamic Rep.IraqIrelandIsraelItalyJamaicaJapanJordanKazakhstanKenyaKiribatiKorea, Rep.KuwaitKyrgyz RepublicLao PDRLate-demographic dividendLatin America & Caribbean Latin America & Caribbean (excluding high income)Latin America & the Caribbean (IDA & IBRD countries)LatviaLeast developed countries: UN classificationLebanonLesothoLiberiaLibyaLithuaniaLow & middle incomeLower middle incomeLuxembourgMacao SAR, ChinaMacedonia, FYRMadagascarMalawiMalaysiaMaldivesMaliMaltaMauritaniaMauritiusMexicoMiddle East & North AfricaMiddle East & North Africa (excluding high income)Middle East & North Africa (IDA & IBRD countries)Middle incomeMoldovaMongoliaMoroccoMozambiqueMyanmarNamibiaNepalNetherlandsNew CaledoniaNew ZealandNicaraguaNigerNigeriaNorth AmericaNorwayOECD membersOmanOther small statesPacific island small statesPakistanPalauPanamaPapua New GuineaParaguayPeruPhilippinesPolandPortugalPost-demographic dividendPre-demographic dividendQatarRomaniaRussian FederationRwandaSamoaSao Tome and PrincipeSaudi ArabiaSenegalSerbiaSeychellesSierra LeoneSingaporeSlovak RepublicSloveniaSmall statesSolomon IslandsSomaliaSouth AfricaSouth AsiaSouth Asia (IDA & IBRD)SpainSri LankaSt. Kitts and NevisSt. LuciaSt. Vincent and the GrenadinesSub-Saharan Africa Sub-Saharan Africa (excluding high income)Sub-Saharan Africa (IDA & IBRD countries)SudanSurinameSwazilandSwedenSwitzerlandSyrian Arab RepublicTajikistanTanzaniaThailandTimor-LesteTogoTongaTrinidad and TobagoTunisiaTurkeyTurkmenistanTurks and Caicos IslandsTuvaluUgandaUkraineUnited Arab EmiratesUnited KingdomUnited StatesUpper middle incomeUruguayVanuatuVenezuela, RBVietnamVirgin Islands (U.S.)WorldYemen, Rep.ZambiaZimbabwe línea de tiempo (timeline):
En esta escala de tiempo se presenta un gráfico de 1963 y 2016 de OECD members. Los datos de 1962 están ausentes. El número de observaciones reales por fecha: 54.
Fuente (nombre):
Indicadores del desarrollo mundial
Fuente (organización):
World Bank staff estimates from the Comtrade database maintained by the United Nations Statistics Division.
Categorías:
Agriculture & Rural Development, Private Sector, Trade
Se ha actualizado:
23 abr 2017 año
Los indicadores de los cambios de valor en los últimos años
Mínimo:
1.426
1 ene 2009 año
Máximo:
7.862
1 ene 1964 año
A la fecha de observación
Valor
Cambio absoluto
El cambio con respecto al valor anterior
1 ene 1963 año
7.006
+7.006
0.0%
1 ene 1964 año
7.862
+0.856
12.22%
1 ene 1965 año
7.31
-0.551
-7.01%
1 ene 1966 año
6.768
-0.543
-7.42%
1 ene 1967 año
6.593
-0.175
-2.59%
1 ene 1968 año
5.978
-0.615
-9.32%
1 ene 1969 año
5.749
-0.229
-3.84%
1 ene 1970 año
5.459
-0.289
-5.03%
1 ene 1971 año
5.092
-0.368
-6.74%
1 ene 1972 año
4.703
-0.389
-7.64%
1 ene 1973 año
4.83
+0.127
2.71%
1 ene 1974 año
5.12
+0.29
6.0%
1 ene 1975 año
4.464
-0.655
-12.8%
1 ene 1976 año
3.769
-0.695
-15.58%
1 ene 1977 año
4.297
+0.528
14.0%
1 ene 1978 año
4.013
-0.283
-6.6%
1 ene 1979 año
3.976
-0.038
-0.94%
1 ene 1980 año
3.961
-0.014
-0.36%
1 ene 1981 año
3.649
-0.312
-7.88%
1 ene 1982 año
3.306
-0.343
-9.4%
1 ene 1983 año
3.083
-0.224
-6.76%
1 ene 1984 año
3.122
+0.04
1.28%
1 ene 1985 año
3.183
+0.061
1.95%
1 ene 1986 año
3.013
-0.17
-5.33%
1 ene 1987 año
3.154
+0.14
4.65%
1 ene 1988 año
3.398
+0.245
7.77%
1 ene 1989 año
3.451
+0.053
1.56%
1 ene 1990 año
3.263
-0.188
-5.45%
1 ene 1991 año
2.926
-0.337
-10.34%
1 ene 1992 año
2.706
-0.22
-7.51%
1 ene 1993 año
2.644
-0.062
-2.3%
1 ene 1994 año
2.481
-0.163
-6.15%
1 ene 1995 año
2.661
+0.179
7.23%
1 ene 1996 año
2.693
+0.032
1.22%
1 ene 1997 año
2.321
-0.372
-13.81%
1 ene 1998 año
2.202
-0.119
-5.14%
1 ene 1999 año
2.025
-0.176
-8.02%
1 ene 2000 año
1.917
-0.108
-5.35%
1 ene 2001 año
1.913
-0.004
-0.21%
1 ene 2002 año
1.806
-0.107
-5.58%
1 ene 2003 año
1.817
+0.01
0.57%
1 ene 2004 año
1.791
-0.026
-1.43%
1 ene 2005 año
1.751
-0.039
-2.2%
1 ene 2006 año
1.636
-0.115
-6.59%
1 ene 2007 año
1.574
-0.062
-3.79%
1 ene 2008 año
1.551
-0.022
-1.41%
1 ene 2009 año
1.426
-0.125
-8.06%
1 ene 2010 año
1.475
+0.049
3.45%
1 ene 2011 año
1.616
+0.14
9.5%
1 ene 2012 año
1.711
+0.096
5.92%
1 ene 2013 año
1.612
-0.099
-5.81%
1 ene 2014 año
1.649
+0.037
2.32%
1 ene 2015 año
1.599
-0.05
-3.02%
1 ene 2016 año
1.518
-0.082
-5.12%
Ranking de los países por los datos estadísticos actuales


Comentarios: