29
/es/
es
AIzaSyAYiBZKx7MnpbEhh9jyipgxe19OcubqV5w
April 1, 2024
33221
European Union
EUU
false
2
1
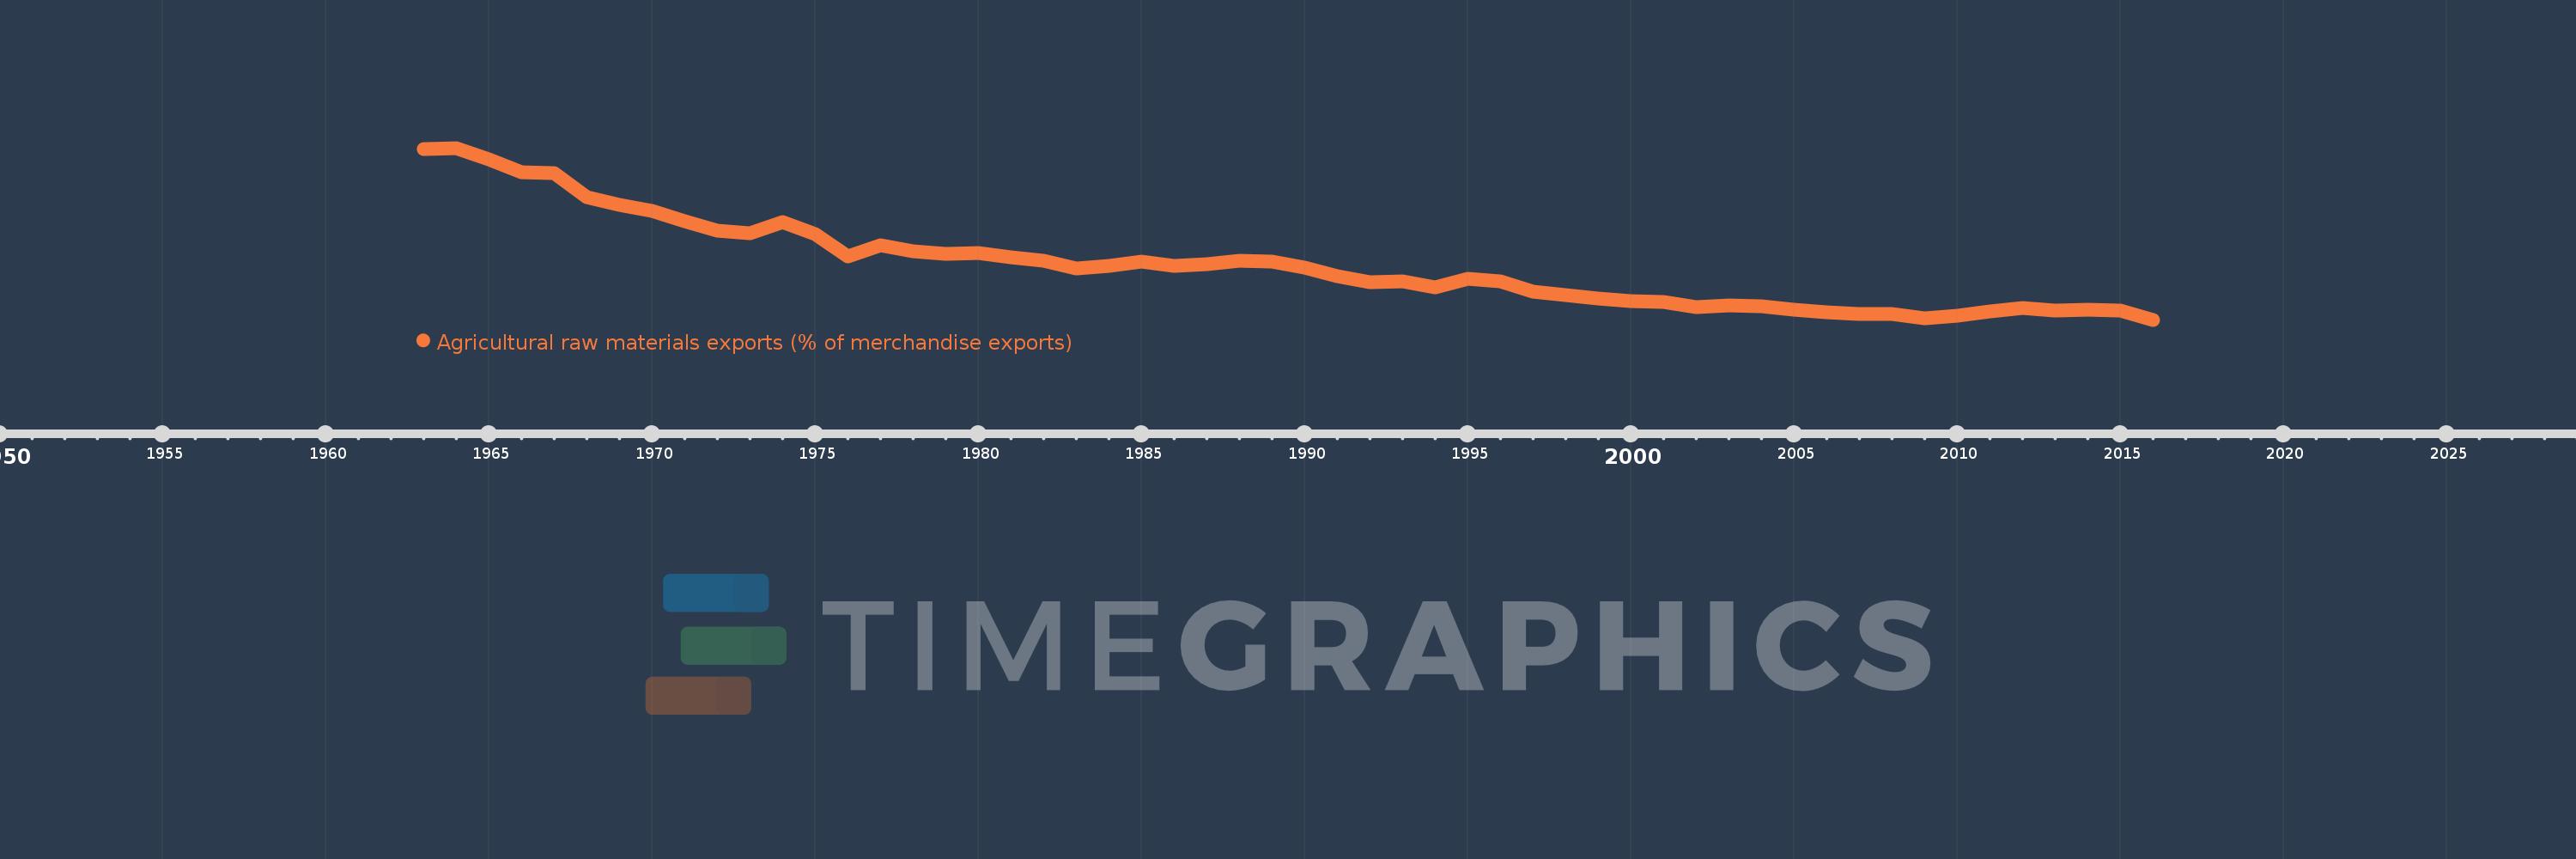
Agricultural raw materials exports (% of merchandise exports)
2016,2015,2014,2013,2012,2011,2010,2009,2008,2007,2006,2005,2004,2003,2002,2001,2000,1999,1998,1997,1996,1995,1994,1993,1992,1991,1990,1989,1988,1987,1986,1985,1984,1983,1982,1981,1980,1979,1978,1977,1976,1975,1974,1973,1972,1971,1970,1969,1968,1967,1966,1965,1964,1963
Estas estadísticas en otros países:
AfghanistanAlbaniaAlgeriaAndorraAngolaAntigua and BarbudaArab WorldArgentinaArmeniaArubaAustraliaAustriaAzerbaijanBahamas, TheBahrainBangladeshBarbadosBelarusBelgiumBelizeBeninBermudaBhutanBoliviaBosnia and HerzegovinaBotswanaBrazilBrunei DarussalamBulgariaBurkina FasoBurundiCabo VerdeCambodiaCameroonCanadaCaribbean small statesCayman IslandsCentral African RepublicCentral Europe and the BalticsChadChileChinaColombiaComorosCongo, Dem. Rep.Congo, Rep.Costa RicaCote d'IvoireCroatiaCubaCyprusCzech RepublicDenmarkDjiboutiDominicaDominican RepublicEarly-demographic dividendEast Asia & PacificEast Asia & Pacific (excluding high income)East Asia & Pacific (IDA & IBRD countries)EcuadorEgypt, Arab Rep.El SalvadorEquatorial GuineaEritreaEstoniaEthiopiaEuro areaEurope & Central AsiaEurope & Central Asia (excluding high income)Europe & Central Asia (IDA & IBRD countries)European UnionFaroe IslandsFijiFinlandFragile and conflict affected situationsFranceFrench PolynesiaGabonGambia, TheGeorgiaGermanyGhanaGreeceGreenlandGrenadaGuatemalaGuineaGuinea-BissauGuyanaHaitiHeavily indebted poor countries (HIPC)High incomeHondurasHong Kong SAR, ChinaHungaryIBRD onlyIcelandIDA & IBRD totalIDA blendIDA onlyIDA totalIndiaIndonesiaIran, Islamic Rep.IraqIrelandIsraelItalyJamaicaJapanJordanKazakhstanKenyaKiribatiKorea, Rep.KuwaitKyrgyz RepublicLao PDRLate-demographic dividendLatin America & Caribbean Latin America & Caribbean (excluding high income)Latin America & the Caribbean (IDA & IBRD countries)LatviaLeast developed countries: UN classificationLebanonLesothoLiberiaLibyaLithuaniaLow & middle incomeLower middle incomeLuxembourgMacao SAR, ChinaMacedonia, FYRMadagascarMalawiMalaysiaMaldivesMaliMaltaMauritaniaMauritiusMexicoMiddle East & North AfricaMiddle East & North Africa (excluding high income)Middle East & North Africa (IDA & IBRD countries)Middle incomeMoldovaMongoliaMoroccoMozambiqueMyanmarNamibiaNepalNetherlandsNew CaledoniaNew ZealandNicaraguaNigerNigeriaNorth AmericaNorwayOECD membersOmanOther small statesPacific island small statesPakistanPalauPanamaPapua New GuineaParaguayPeruPhilippinesPolandPortugalPost-demographic dividendPre-demographic dividendQatarRomaniaRussian FederationRwandaSamoaSao Tome and PrincipeSaudi ArabiaSenegalSerbiaSeychellesSierra LeoneSingaporeSlovak RepublicSloveniaSmall statesSolomon IslandsSomaliaSouth AfricaSouth AsiaSouth Asia (IDA & IBRD)SpainSri LankaSt. Kitts and NevisSt. LuciaSt. Vincent and the GrenadinesSub-Saharan Africa Sub-Saharan Africa (excluding high income)Sub-Saharan Africa (IDA & IBRD countries)SudanSurinameSwazilandSwedenSwitzerlandSyrian Arab RepublicTajikistanTanzaniaThailandTimor-LesteTogoTongaTrinidad and TobagoTunisiaTurkeyTurkmenistanTurks and Caicos IslandsTuvaluUgandaUkraineUnited Arab EmiratesUnited KingdomUnited StatesUpper middle incomeUruguayVanuatuVenezuela, RBVietnamVirgin Islands (U.S.)WorldYemen, Rep.ZambiaZimbabwe línea de tiempo (timeline):
En esta escala de tiempo se presenta un gráfico de 1963 y 2016 de European Union. Los datos de 1962 están ausentes. El número de observaciones reales por fecha: 54.
Fuente (nombre):
Indicadores del desarrollo mundial
Fuente (organización):
World Bank staff estimates from the Comtrade database maintained by the United Nations Statistics Division.
Categorías:
Agriculture & Rural Development, Private Sector, Trade
Se ha actualizado:
23 abr 2017 año
Los indicadores de los cambios de valor en los últimos años
Mínimo:
1.238
1 ene 2016 año
Máximo:
5.245
1 ene 1964 año
A la fecha de observación
Valor
Cambio absoluto
El cambio con respecto al valor anterior
1 ene 1963 año
5.211
+5.211
0.0%
1 ene 1964 año
5.245
+0.034
0.65%
1 ene 1965 año
4.988
-0.257
-4.89%
1 ene 1966 año
4.687
-0.301
-6.03%
1 ene 1967 año
4.661
-0.026
-0.56%
1 ene 1968 año
4.106
-0.555
-11.9%
1 ene 1969 año
3.919
-0.187
-4.56%
1 ene 1970 año
3.78
-0.139
-3.55%
1 ene 1971 año
3.539
-0.24
-6.36%
1 ene 1972 año
3.32
-0.219
-6.19%
1 ene 1973 año
3.259
-0.061
-1.84%
1 ene 1974 año
3.507
+0.248
7.59%
1 ene 1975 año
3.226
-0.28
-7.99%
1 ene 1976 año
2.711
-0.515
-15.97%
1 ene 1977 año
2.967
+0.256
9.43%
1 ene 1978 año
2.844
-0.123
-4.13%
1 ene 1979 año
2.778
-0.066
-2.34%
1 ene 1980 año
2.794
+0.016
0.59%
1 ene 1981 año
2.703
-0.092
-3.28%
1 ene 1982 año
2.62
-0.083
-3.06%
1 ene 1983 año
2.432
-0.188
-7.19%
1 ene 1984 año
2.497
+0.065
2.69%
1 ene 1985 año
2.602
+0.105
4.21%
1 ene 1986 año
2.49
-0.112
-4.32%
1 ene 1987 año
2.527
+0.037
1.47%
1 ene 1988 año
2.61
+0.083
3.3%
1 ene 1989 año
2.591
-0.019
-0.74%
1 ene 1990 año
2.456
-0.134
-5.19%
1 ene 1991 año
2.255
-0.201
-8.18%
1 ene 1992 año
2.107
-0.149
-6.59%
1 ene 1993 año
2.136
+0.029
1.38%
1 ene 1994 año
1.984
-0.152
-7.13%
1 ene 1995 año
2.188
+0.205
10.33%
1 ene 1996 año
2.134
-0.054
-2.48%
1 ene 1997 año
1.888
-0.247
-11.56%
1 ene 1998 año
1.815
-0.072
-3.83%
1 ene 1999 año
1.733
-0.083
-4.56%
1 ene 2000 año
1.676
-0.056
-3.24%
1 ene 2001 año
1.659
-0.018
-1.06%
1 ene 2002 año
1.533
-0.125
-7.55%
1 ene 2003 año
1.564
+0.031
2.02%
1 ene 2004 año
1.557
-0.007
-0.45%
1 ene 2005 año
1.468
-0.089
-5.71%
1 ene 2006 año
1.406
-0.062
-4.25%
1 ene 2007 año
1.378
-0.028
-2.01%
1 ene 2008 año
1.372
-0.006
-0.4%
1 ene 2009 año
1.27
-0.102
-7.42%
1 ene 2010 año
1.334
+0.064
5.01%
1 ene 2011 año
1.431
+0.097
7.3%
1 ene 2012 año
1.513
+0.082
5.73%
1 ene 2013 año
1.448
-0.066
-4.35%
1 ene 2014 año
1.475
+0.028
1.92%
1 ene 2015 año
1.451
-0.024
-1.62%
1 ene 2016 año
1.238
-0.213
-14.68%
Ranking de los países por los datos estadísticos actuales


Comentarios: