29
/es/
es
AIzaSyAYiBZKx7MnpbEhh9jyipgxe19OcubqV5w
April 1, 2024
65673
Algeria
DZA
true
2
1
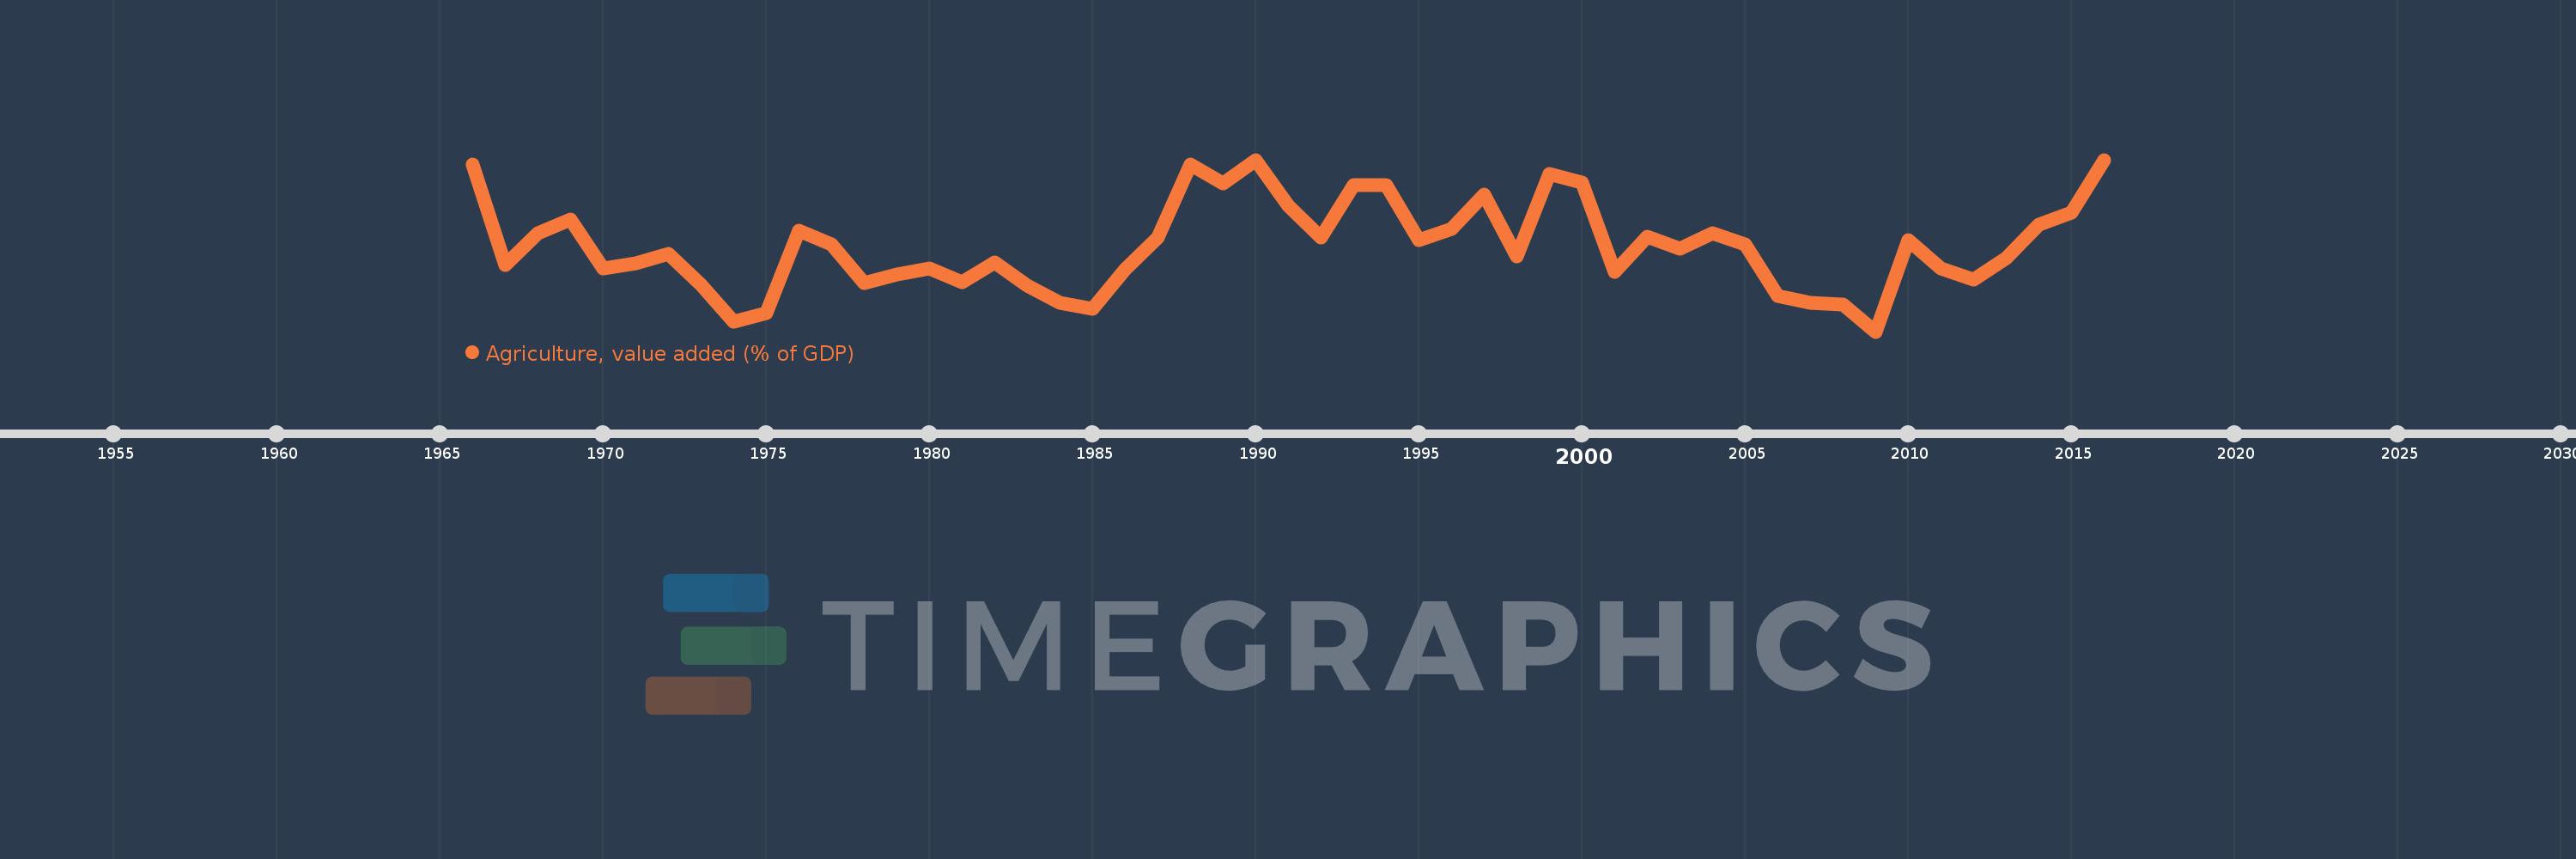
Agriculture, value added (% of GDP)
2016,2015,2014,2013,2012,2011,2010,2009,2008,2007,2006,2005,2004,2003,2002,2001,2000,1999,1998,1997,1996,1995,1994,1993,1992,1991,1990,1989,1988,1987,1986,1985,1984,1983,1982,1981,1980,1979,1978,1977,1976,1975,1974,1973,1972,1971,1970,1969,1968,1967,1966
Estas estadísticas en otros países:
AfghanistanAlbaniaAlgeriaAndorraAngolaAntigua and BarbudaArab WorldArgentinaArmeniaArubaAustraliaAustriaAzerbaijanBahamas, TheBahrainBangladeshBarbadosBelarusBelgiumBelizeBeninBermudaBhutanBoliviaBosnia and HerzegovinaBotswanaBrazilBrunei DarussalamBulgariaBurkina FasoBurundiCabo VerdeCambodiaCameroonCanadaCaribbean small statesCayman IslandsCentral African RepublicCentral Europe and the BalticsChadChileChinaColombiaComorosCongo, Dem. Rep.Congo, Rep.Costa RicaCote d'IvoireCroatiaCubaCyprusCzech RepublicDenmarkDjiboutiDominicaDominican RepublicEarly-demographic dividendEast Asia & PacificEast Asia & Pacific (excluding high income)East Asia & Pacific (IDA & IBRD countries)EcuadorEgypt, Arab Rep.El SalvadorEquatorial GuineaEritreaEstoniaEthiopiaEuro areaEurope & Central AsiaEurope & Central Asia (excluding high income)Europe & Central Asia (IDA & IBRD countries)European UnionFijiFinlandFragile and conflict affected situationsFranceFrench PolynesiaGabonGambia, TheGeorgiaGermanyGhanaGreeceGrenadaGuatemalaGuineaGuinea-BissauGuyanaHeavily indebted poor countries (HIPC)High incomeHondurasHong Kong SAR, ChinaHungaryIBRD onlyIcelandIDA & IBRD totalIDA blendIDA onlyIDA totalIndiaIndonesiaIran, Islamic Rep.IrelandItalyJamaicaJapanJordanKazakhstanKenyaKiribatiKorea, Rep.KosovoKuwaitKyrgyz RepublicLao PDRLate-demographic dividendLatin America & Caribbean Latin America & Caribbean (excluding high income)Latin America & the Caribbean (IDA & IBRD countries)LatviaLeast developed countries: UN classificationLebanonLesothoLibyaLithuaniaLow & middle incomeLow incomeLower middle incomeLuxembourgMacao SAR, ChinaMacedonia, FYRMadagascarMalawiMalaysiaMaldivesMaliMaltaMarshall IslandsMauritaniaMauritiusMexicoMicronesia, Fed. Sts.Middle East & North AfricaMiddle East & North Africa (excluding high income)Middle East & North Africa (IDA & IBRD countries)Middle incomeMoldovaMongoliaMontenegroMoroccoMozambiqueMyanmarNamibiaNepalNetherlandsNew CaledoniaNew ZealandNicaraguaNigerNigeriaNorth AmericaNorwayOECD membersOmanOther small statesPacific island small statesPakistanPalauPanamaPapua New GuineaParaguayPeruPhilippinesPolandPortugalPost-demographic dividendPre-demographic dividendPuerto RicoQatarRomaniaRussian FederationRwandaSao Tome and PrincipeSaudi ArabiaSenegalSerbiaSeychellesSierra LeoneSingaporeSlovak RepublicSloveniaSmall statesSolomon IslandsSomaliaSouth AfricaSouth AsiaSouth Asia (IDA & IBRD)SpainSri LankaSt. Kitts and NevisSt. LuciaSt. Vincent and the GrenadinesSub-Saharan Africa Sub-Saharan Africa (excluding high income)Sub-Saharan Africa (IDA & IBRD countries)SudanSurinameSwazilandSwedenSwitzerlandSyrian Arab RepublicTajikistanTanzaniaThailandTimor-LesteTogoTongaTrinidad and TobagoTunisiaTurkeyTurkmenistanTuvaluUgandaUkraineUnited KingdomUnited StatesUpper middle incomeUruguayUzbekistanVanuatuVenezuela, RBVietnamWest Bank and GazaWorldYemen, Rep.ZambiaZimbabwe línea de tiempo (timeline):
En esta escala de tiempo se presenta un gráfico de 1966 y 2016 de Algeria. Los datos de 1965 están ausentes. El número de observaciones reales por fecha: 51.
Fuente (nombre):
Indicadores del desarrollo mundial
Fuente (organización):
World Bank national accounts data, and OECD National Accounts data files.
Categorías:
Agriculture & Rural Development, Economy & Growth, Climate Change
Se ha actualizado:
23 abr 2017 año
Los indicadores de los cambios de valor en los últimos años
Mínimo:
6.681
1 ene 2009 año
Máximo:
13.052
1 ene 2016 año
A la fecha de observación
Valor
Cambio absoluto
El cambio con respecto al valor anterior
1 ene 1966 año
12.876
+12.876
0.0%
1 ene 1967 año
9.137
-3.739
-29.04%
1 ene 1968 año
10.331
+1.193
13.06%
1 ene 1969 año
10.853
+0.523
5.06%
1 ene 1970 año
9.03
-1.823
-16.8%
1 ene 1971 año
9.205
+0.175
1.94%
1 ene 1972 año
9.569
+0.364
3.95%
1 ene 1973 año
8.421
-1.148
-12.0%
1 ene 1974 año
7.04
-1.381
-16.4%
1 ene 1975 año
7.367
+0.327
4.64%
1 ene 1976 año
10.418
+3.052
41.43%
1 ene 1977 año
9.927
-0.492
-4.72%
1 ene 1978 año
8.47
-1.457
-14.67%
1 ene 1979 año
8.806
+0.335
3.96%
1 ene 1980 año
9.017
+0.211
2.4%
1 ene 1981 año
8.509
-0.507
-5.63%
1 ene 1982 año
9.235
+0.726
8.53%
1 ene 1983 año
8.39
-0.845
-9.15%
1 ene 1984 año
7.746
-0.644
-7.67%
1 ene 1985 año
7.531
-0.215
-2.78%
1 ene 1986 año
8.996
+1.465
19.45%
1 ene 1987 año
10.179
+1.184
13.16%
1 ene 1988 año
12.875
+2.695
26.48%
1 ene 1989 año
12.168
-0.707
-5.49%
1 ene 1990 año
13.039
+0.871
7.16%
1 ene 1991 año
11.358
-1.681
-12.89%
1 ene 1992 año
10.167
-1.191
-10.49%
1 ene 1993 año
12.127
+1.96
19.28%
1 ene 1994 año
12.097
-0.03
-0.25%
1 ene 1995 año
10.058
-2.039
-16.85%
1 ene 1996 año
10.498
+0.439
4.37%
1 ene 1997 año
11.767
+1.269
12.09%
1 ene 1998 año
9.482
-2.284
-19.41%
1 ene 1999 año
12.533
+3.051
32.18%
1 ene 2000 año
12.201
-0.332
-2.65%
1 ene 2001 año
8.88
-3.321
-27.22%
1 ene 2002 año
10.196
+1.316
14.82%
1 ene 2003 año
9.766
-0.43
-4.22%
1 ene 2004 año
10.318
+0.553
5.66%
1 ene 2005 año
9.904
-0.415
-4.02%
1 ene 2006 año
8.013
-1.891
-19.09%
1 ene 2007 año
7.745
-0.268
-3.34%
1 ene 2008 año
7.688
-0.057
-0.74%
1 ene 2009 año
6.681
-1.008
-13.11%
1 ene 2010 año
10.066
+3.386
50.68%
1 ene 2011 año
9.029
-1.037
-10.3%
1 ene 2012 año
8.615
-0.414
-4.59%
1 ene 2013 año
9.396
+0.78
9.06%
1 ene 2014 año
10.648
+1.252
13.33%
1 ene 2015 año
11.095
+0.447
4.2%
1 ene 2016 año
13.052
+1.957
17.64%
Ranking de los países por los datos estadísticos actuales


Comentarios: