29
/es/
es
AIzaSyAYiBZKx7MnpbEhh9jyipgxe19OcubqV5w
April 1, 2024
169629
Korea, Rep.
KOR
true
2
1
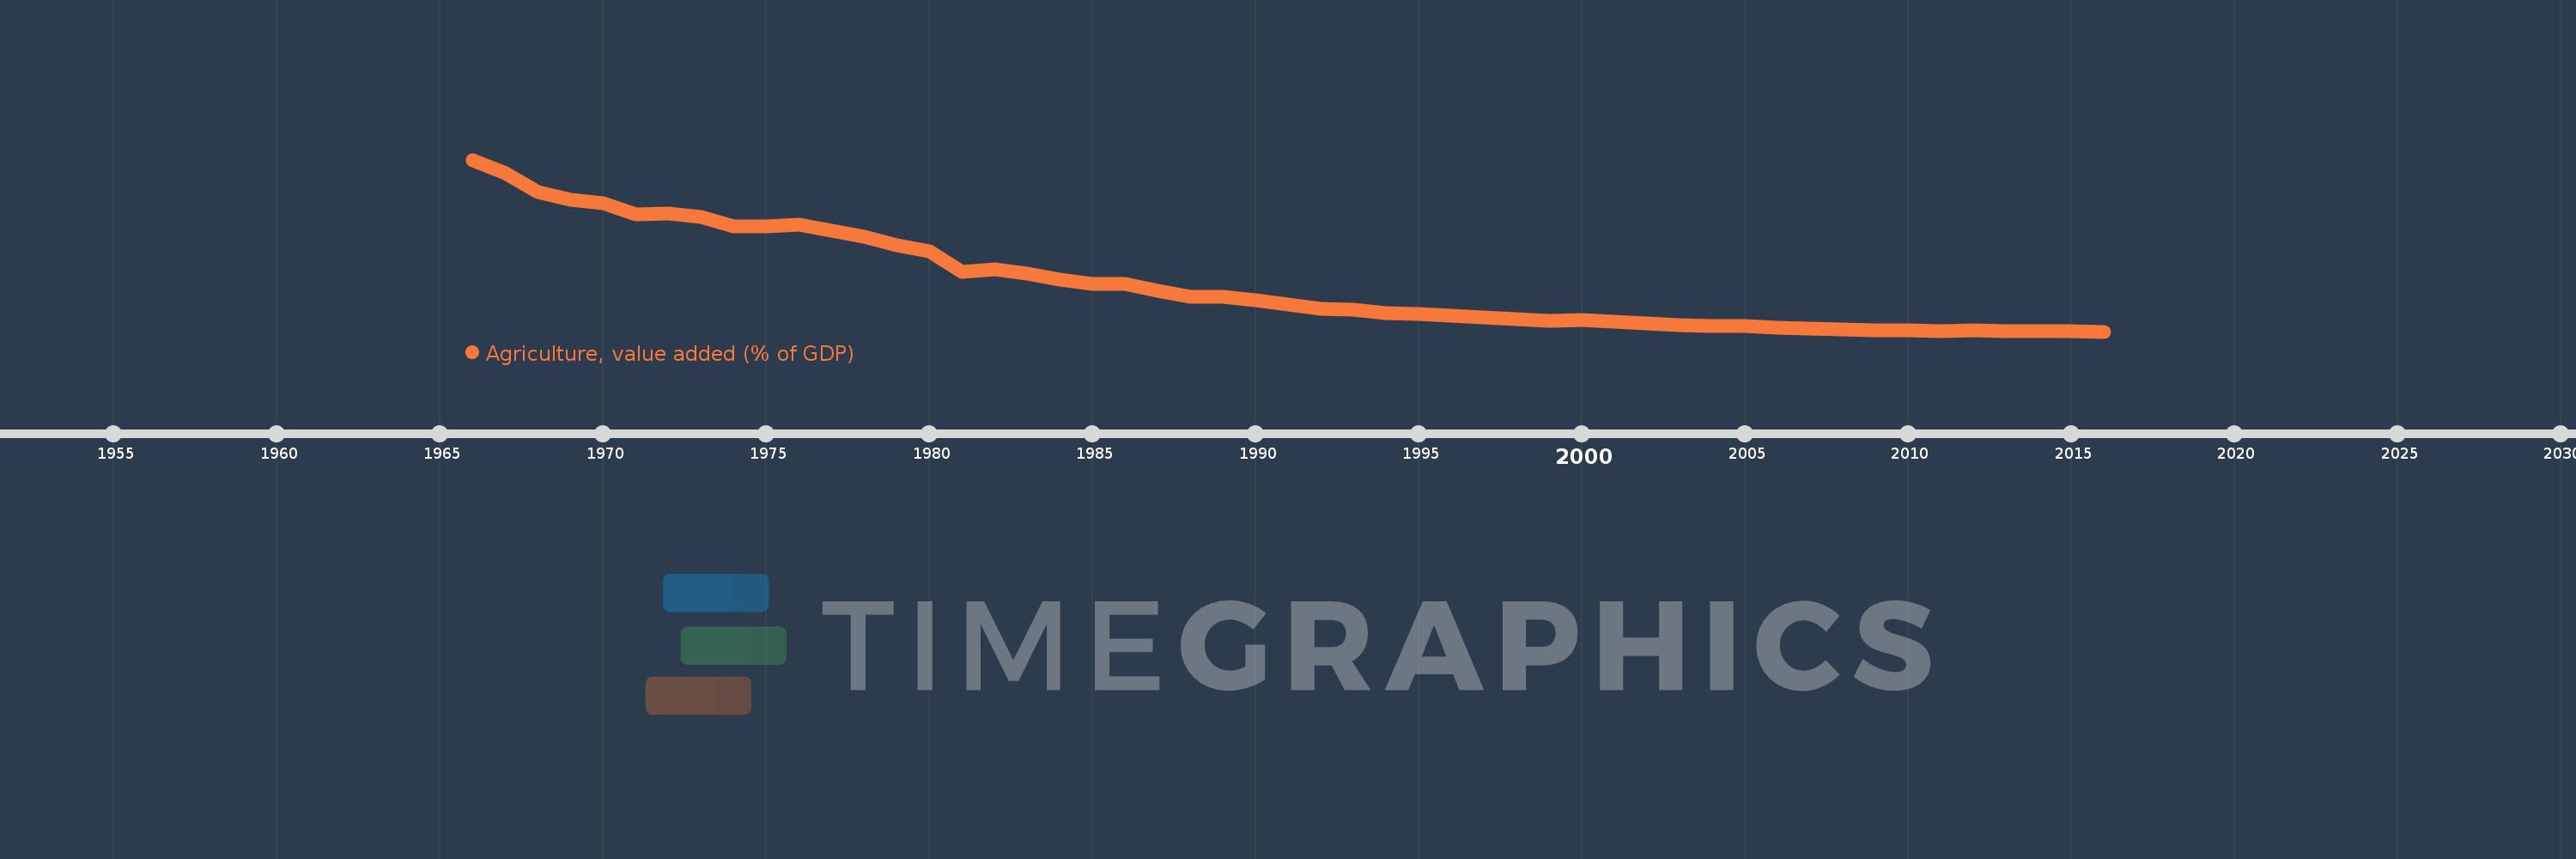
Agriculture, value added (% of GDP)
2016,2015,2014,2013,2012,2011,2010,2009,2008,2007,2006,2005,2004,2003,2002,2001,2000,1999,1998,1997,1996,1995,1994,1993,1992,1991,1990,1989,1988,1987,1986,1985,1984,1983,1982,1981,1980,1979,1978,1977,1976,1975,1974,1973,1972,1971,1970,1969,1968,1967,1966
Estas estadísticas en otros países:
AfghanistanAlbaniaAlgeriaAndorraAngolaAntigua and BarbudaArab WorldArgentinaArmeniaArubaAustraliaAustriaAzerbaijanBahamas, TheBahrainBangladeshBarbadosBelarusBelgiumBelizeBeninBermudaBhutanBoliviaBosnia and HerzegovinaBotswanaBrazilBrunei DarussalamBulgariaBurkina FasoBurundiCabo VerdeCambodiaCameroonCanadaCaribbean small statesCayman IslandsCentral African RepublicCentral Europe and the BalticsChadChileChinaColombiaComorosCongo, Dem. Rep.Congo, Rep.Costa RicaCote d'IvoireCroatiaCubaCyprusCzech RepublicDenmarkDjiboutiDominicaDominican RepublicEarly-demographic dividendEast Asia & PacificEast Asia & Pacific (excluding high income)East Asia & Pacific (IDA & IBRD countries)EcuadorEgypt, Arab Rep.El SalvadorEquatorial GuineaEritreaEstoniaEthiopiaEuro areaEurope & Central AsiaEurope & Central Asia (excluding high income)Europe & Central Asia (IDA & IBRD countries)European UnionFijiFinlandFragile and conflict affected situationsFranceFrench PolynesiaGabonGambia, TheGeorgiaGermanyGhanaGreeceGrenadaGuatemalaGuineaGuinea-BissauGuyanaHeavily indebted poor countries (HIPC)High incomeHondurasHong Kong SAR, ChinaHungaryIBRD onlyIcelandIDA & IBRD totalIDA blendIDA onlyIDA totalIndiaIndonesiaIran, Islamic Rep.IrelandItalyJamaicaJapanJordanKazakhstanKenyaKiribatiKorea, Rep.KosovoKuwaitKyrgyz RepublicLao PDRLate-demographic dividendLatin America & Caribbean Latin America & Caribbean (excluding high income)Latin America & the Caribbean (IDA & IBRD countries)LatviaLeast developed countries: UN classificationLebanonLesothoLibyaLithuaniaLow & middle incomeLow incomeLower middle incomeLuxembourgMacao SAR, ChinaMacedonia, FYRMadagascarMalawiMalaysiaMaldivesMaliMaltaMarshall IslandsMauritaniaMauritiusMexicoMicronesia, Fed. Sts.Middle East & North AfricaMiddle East & North Africa (excluding high income)Middle East & North Africa (IDA & IBRD countries)Middle incomeMoldovaMongoliaMontenegroMoroccoMozambiqueMyanmarNamibiaNepalNetherlandsNew CaledoniaNew ZealandNicaraguaNigerNigeriaNorth AmericaNorwayOECD membersOmanOther small statesPacific island small statesPakistanPalauPanamaPapua New GuineaParaguayPeruPhilippinesPolandPortugalPost-demographic dividendPre-demographic dividendPuerto RicoQatarRomaniaRussian FederationRwandaSao Tome and PrincipeSaudi ArabiaSenegalSerbiaSeychellesSierra LeoneSingaporeSlovak RepublicSloveniaSmall statesSolomon IslandsSomaliaSouth AfricaSouth AsiaSouth Asia (IDA & IBRD)SpainSri LankaSt. Kitts and NevisSt. LuciaSt. Vincent and the GrenadinesSub-Saharan Africa Sub-Saharan Africa (excluding high income)Sub-Saharan Africa (IDA & IBRD countries)SudanSurinameSwazilandSwedenSwitzerlandSyrian Arab RepublicTajikistanTanzaniaThailandTimor-LesteTogoTongaTrinidad and TobagoTunisiaTurkeyTurkmenistanTuvaluUgandaUkraineUnited KingdomUnited StatesUpper middle incomeUruguayUzbekistanVanuatuVenezuela, RBVietnamWest Bank and GazaWorldYemen, Rep.ZambiaZimbabwe línea de tiempo (timeline):
En esta escala de tiempo se presenta un gráfico de 1966 y 2016 de Korea, Rep.. Los datos de 1965 están ausentes. El número de observaciones reales por fecha: 51.
Fuente (nombre):
Indicadores del desarrollo mundial
Fuente (organización):
World Bank national accounts data, and OECD National Accounts data files.
Categorías:
Agriculture & Rural Development, Economy & Growth, Climate Change
Se ha actualizado:
23 abr 2017 año
Los indicadores de los cambios de valor en los últimos años
Mínimo:
2.31
1 ene 2016 año
Máximo:
39.36
1 ene 1966 año
A la fecha de observación
Valor
Cambio absoluto
El cambio con respecto al valor anterior
1 ene 1966 año
39.36
+39.36
0.0%
1 ene 1967 año
36.528
-2.831
-7.19%
1 ene 1968 año
32.368
-4.16
-11.39%
1 ene 1969 año
30.685
-1.683
-5.2%
1 ene 1970 año
29.95
-0.734
-2.39%
1 ene 1971 año
27.521
-2.429
-8.11%
1 ene 1972 año
27.852
+0.331
1.2%
1 ene 1973 año
27.027
-0.825
-2.96%
1 ene 1974 año
25.067
-1.96
-7.25%
1 ene 1975 año
24.934
-0.133
-0.53%
1 ene 1976 año
25.389
+0.455
1.82%
1 ene 1977 año
24.106
-1.283
-5.05%
1 ene 1978 año
22.825
-1.281
-5.31%
1 ene 1979 año
20.96
-1.865
-8.17%
1 ene 1980 año
19.545
-1.415
-6.75%
1 ene 1981 año
15.111
-4.433
-22.68%
1 ene 1982 año
15.792
+0.68
4.5%
1 ene 1983 año
14.763
-1.029
-6.51%
1 ene 1984 año
13.496
-1.267
-8.58%
1 ene 1985 año
12.651
-0.846
-6.27%
1 ene 1986 año
12.511
-0.14
-1.11%
1 ene 1987 año
11.054
-1.457
-11.64%
1 ene 1988 año
9.896
-1.158
-10.47%
1 ene 1989 año
9.852
-0.045
-0.45%
1 ene 1990 año
9.135
-0.717
-7.28%
1 ene 1991 año
8.216
-0.919
-10.06%
1 ene 1992 año
7.31
-0.905
-11.02%
1 ene 1993 año
7.106
-0.204
-2.8%
1 ene 1994 año
6.353
-0.753
-10.6%
1 ene 1995 año
6.167
-0.186
-2.93%
1 ene 1996 año
5.822
-0.345
-5.6%
1 ene 1997 año
5.458
-0.364
-6.26%
1 ene 1998 año
4.972
-0.486
-8.9%
1 ene 1999 año
4.637
-0.335
-6.74%
1 ene 2000 año
4.759
+0.122
2.64%
1 ene 2001 año
4.393
-0.366
-7.69%
1 ene 2002 año
4.126
-0.266
-6.07%
1 ene 2003 año
3.764
-0.363
-8.79%
1 ene 2004 año
3.514
-0.25
-6.63%
1 ene 2005 año
3.53
+0.016
0.45%
1 ene 2006 año
3.147
-0.383
-10.84%
1 ene 2007 año
2.989
-0.159
-5.04%
1 ene 2008 año
2.709
-0.28
-9.35%
1 ene 2009 año
2.508
-0.202
-7.44%
1 ene 2010 año
2.588
+0.08
3.2%
1 ene 2011 año
2.471
-0.117
-4.52%
1 ene 2012 año
2.517
+0.046
1.85%
1 ene 2013 año
2.459
-0.058
-2.3%
1 ene 2014 año
2.336
-0.124
-5.03%
1 ene 2015 año
2.329
-0.006
-0.26%
1 ene 2016 año
2.31
-0.02
-0.85%
Ranking de los países por los datos estadísticos actuales


Comentarios: