29
/es/
es
AIzaSyAYiBZKx7MnpbEhh9jyipgxe19OcubqV5w
April 1, 2024
37147
IDA & IBRD total
IBT
false
2
1
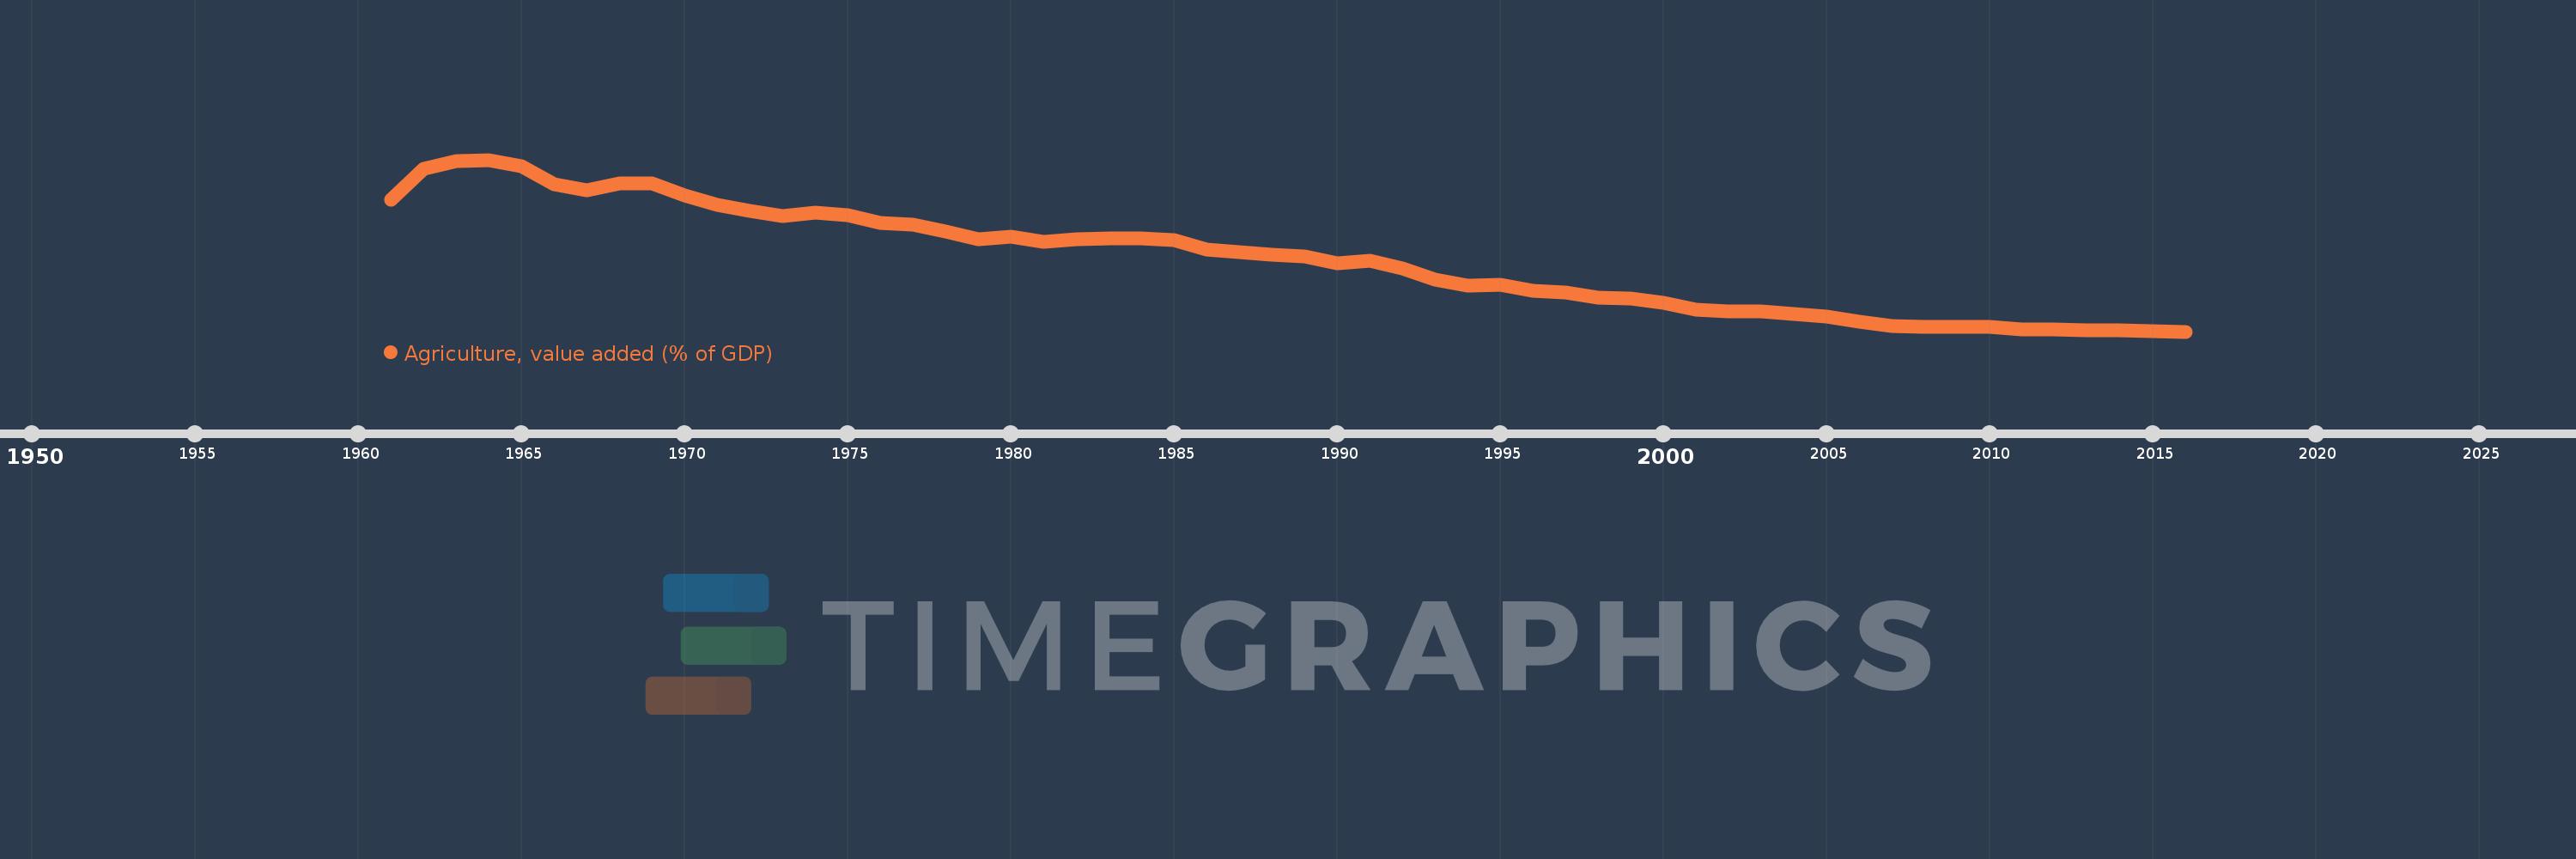
Agriculture, value added (% of GDP)
2016,2015,2014,2013,2012,2011,2010,2009,2008,2007,2006,2005,2004,2003,2002,2001,2000,1999,1998,1997,1996,1995,1994,1993,1992,1991,1990,1989,1988,1987,1986,1985,1984,1983,1982,1981,1980,1979,1978,1977,1976,1975,1974,1973,1972,1971,1970,1969,1968,1967,1966,1965,1964,1963,1962,1961
Estas estadísticas en otros países:
AfghanistanAlbaniaAlgeriaAndorraAngolaAntigua and BarbudaArab WorldArgentinaArmeniaArubaAustraliaAustriaAzerbaijanBahamas, TheBahrainBangladeshBarbadosBelarusBelgiumBelizeBeninBermudaBhutanBoliviaBosnia and HerzegovinaBotswanaBrazilBrunei DarussalamBulgariaBurkina FasoBurundiCabo VerdeCambodiaCameroonCanadaCaribbean small statesCayman IslandsCentral African RepublicCentral Europe and the BalticsChadChileChinaColombiaComorosCongo, Dem. Rep.Congo, Rep.Costa RicaCote d'IvoireCroatiaCubaCyprusCzech RepublicDenmarkDjiboutiDominicaDominican RepublicEarly-demographic dividendEast Asia & PacificEast Asia & Pacific (excluding high income)East Asia & Pacific (IDA & IBRD countries)EcuadorEgypt, Arab Rep.El SalvadorEquatorial GuineaEritreaEstoniaEthiopiaEuro areaEurope & Central AsiaEurope & Central Asia (excluding high income)Europe & Central Asia (IDA & IBRD countries)European UnionFijiFinlandFragile and conflict affected situationsFranceFrench PolynesiaGabonGambia, TheGeorgiaGermanyGhanaGreeceGrenadaGuatemalaGuineaGuinea-BissauGuyanaHeavily indebted poor countries (HIPC)High incomeHondurasHong Kong SAR, ChinaHungaryIBRD onlyIcelandIDA & IBRD totalIDA blendIDA onlyIDA totalIndiaIndonesiaIran, Islamic Rep.IrelandItalyJamaicaJapanJordanKazakhstanKenyaKiribatiKorea, Rep.KosovoKuwaitKyrgyz RepublicLao PDRLate-demographic dividendLatin America & Caribbean Latin America & Caribbean (excluding high income)Latin America & the Caribbean (IDA & IBRD countries)LatviaLeast developed countries: UN classificationLebanonLesothoLibyaLithuaniaLow & middle incomeLow incomeLower middle incomeLuxembourgMacao SAR, ChinaMacedonia, FYRMadagascarMalawiMalaysiaMaldivesMaliMaltaMarshall IslandsMauritaniaMauritiusMexicoMicronesia, Fed. Sts.Middle East & North AfricaMiddle East & North Africa (excluding high income)Middle East & North Africa (IDA & IBRD countries)Middle incomeMoldovaMongoliaMontenegroMoroccoMozambiqueMyanmarNamibiaNepalNetherlandsNew CaledoniaNew ZealandNicaraguaNigerNigeriaNorth AmericaNorwayOECD membersOmanOther small statesPacific island small statesPakistanPalauPanamaPapua New GuineaParaguayPeruPhilippinesPolandPortugalPost-demographic dividendPre-demographic dividendPuerto RicoQatarRomaniaRussian FederationRwandaSao Tome and PrincipeSaudi ArabiaSenegalSerbiaSeychellesSierra LeoneSingaporeSlovak RepublicSloveniaSmall statesSolomon IslandsSomaliaSouth AfricaSouth AsiaSouth Asia (IDA & IBRD)SpainSri LankaSt. Kitts and NevisSt. LuciaSt. Vincent and the GrenadinesSub-Saharan Africa Sub-Saharan Africa (excluding high income)Sub-Saharan Africa (IDA & IBRD countries)SudanSurinameSwazilandSwedenSwitzerlandSyrian Arab RepublicTajikistanTanzaniaThailandTimor-LesteTogoTongaTrinidad and TobagoTunisiaTurkeyTurkmenistanTuvaluUgandaUkraineUnited KingdomUnited StatesUpper middle incomeUruguayUzbekistanVanuatuVenezuela, RBVietnamWest Bank and GazaWorldYemen, Rep.ZambiaZimbabwe línea de tiempo (timeline):
En esta escala de tiempo se presenta un gráfico de 1961 y 2016 de IDA & IBRD total. Los datos de 1960 están ausentes. El número de observaciones reales por fecha: 56.
Fuente (nombre):
Indicadores del desarrollo mundial
Fuente (organización):
World Bank national accounts data, and OECD National Accounts data files.
Categorías:
Agriculture & Rural Development, Economy & Growth, Climate Change
Se ha actualizado:
23 abr 2017 año
Los indicadores de los cambios de valor en los últimos años
Mínimo:
9.289
1 ene 2016 año
Máximo:
35.343
1 ene 1964 año
A la fecha de observación
Valor
Cambio absoluto
El cambio con respecto al valor anterior
1 ene 1961 año
29.28
+29.28
0.0%
1 ene 1962 año
33.989
+4.709
16.08%
1 ene 1963 año
35.211
+1.222
3.6%
1 ene 1964 año
35.343
+0.132
0.37%
1 ene 1965 año
34.311
-1.032
-2.92%
1 ene 1966 año
31.567
-2.744
-8.0%
1 ene 1967 año
30.722
-0.845
-2.68%
1 ene 1968 año
31.709
+0.988
3.22%
1 ene 1969 año
31.782
+0.073
0.23%
1 ene 1970 año
29.925
-1.857
-5.84%
1 ene 1971 año
28.442
-1.483
-4.96%
1 ene 1972 año
27.611
-0.831
-2.92%
1 ene 1973 año
26.873
-0.738
-2.67%
1 ene 1974 año
27.37
+0.496
1.85%
1 ene 1975 año
26.891
-0.479
-1.75%
1 ene 1976 año
25.745
-1.145
-4.26%
1 ene 1977 año
25.494
-0.252
-0.98%
1 ene 1978 año
24.489
-1.005
-3.94%
1 ene 1979 año
23.313
-1.175
-4.8%
1 ene 1980 año
23.684
+0.371
1.59%
1 ene 1981 año
22.904
-0.78
-3.29%
1 ene 1982 año
23.33
+0.426
1.86%
1 ene 1983 año
23.423
+0.093
0.4%
1 ene 1984 año
23.407
-0.016
-0.07%
1 ene 1985 año
23.133
-0.274
-1.17%
1 ene 1986 año
21.792
-1.341
-5.8%
1 ene 1987 año
21.357
-0.435
-2.0%
1 ene 1988 año
20.95
-0.408
-1.91%
1 ene 1989 año
20.677
-0.273
-1.3%
1 ene 1990 año
19.659
-1.018
-4.92%
1 ene 1991 año
20.072
+0.413
2.1%
1 ene 1992 año
18.845
-1.227
-6.11%
1 ene 1993 año
17.191
-1.655
-8.78%
1 ene 1994 año
16.282
-0.909
-5.29%
1 ene 1995 año
16.388
+0.107
0.66%
1 ene 1996 año
15.47
-0.919
-5.61%
1 ene 1997 año
15.268
-0.201
-1.3%
1 ene 1998 año
14.496
-0.773
-5.06%
1 ene 1999 año
14.256
-0.24
-1.65%
1 ene 2000 año
13.624
-0.632
-4.44%
1 ene 2001 año
12.559
-1.065
-7.82%
1 ene 2002 año
12.369
-0.189
-1.51%
1 ene 2003 año
12.297
-0.073
-0.59%
1 ene 2004 año
11.937
-0.36
-2.93%
1 ene 2005 año
11.572
-0.365
-3.06%
1 ene 2006 año
10.725
-0.847
-7.32%
1 ene 2007 año
10.133
-0.592
-5.52%
1 ene 2008 año
10.037
-0.096
-0.95%
1 ene 2009 año
9.992
-0.045
-0.44%
1 ene 2010 año
10.005
+0.013
0.13%
1 ene 2011 año
9.669
-0.336
-3.36%
1 ene 2012 año
9.629
-0.039
-0.41%
1 ene 2013 año
9.463
-0.166
-1.72%
1 ene 2014 año
9.461
-0.002
-0.03%
1 ene 2015 año
9.302
-0.159
-1.68%
1 ene 2016 año
9.289
-0.013
-0.14%
Ranking de los países por los datos estadísticos actuales


Comentarios: