29
/es/
es
AIzaSyAYiBZKx7MnpbEhh9jyipgxe19OcubqV5w
April 1, 2024
168433
Kiribati
KIR
true
2
1
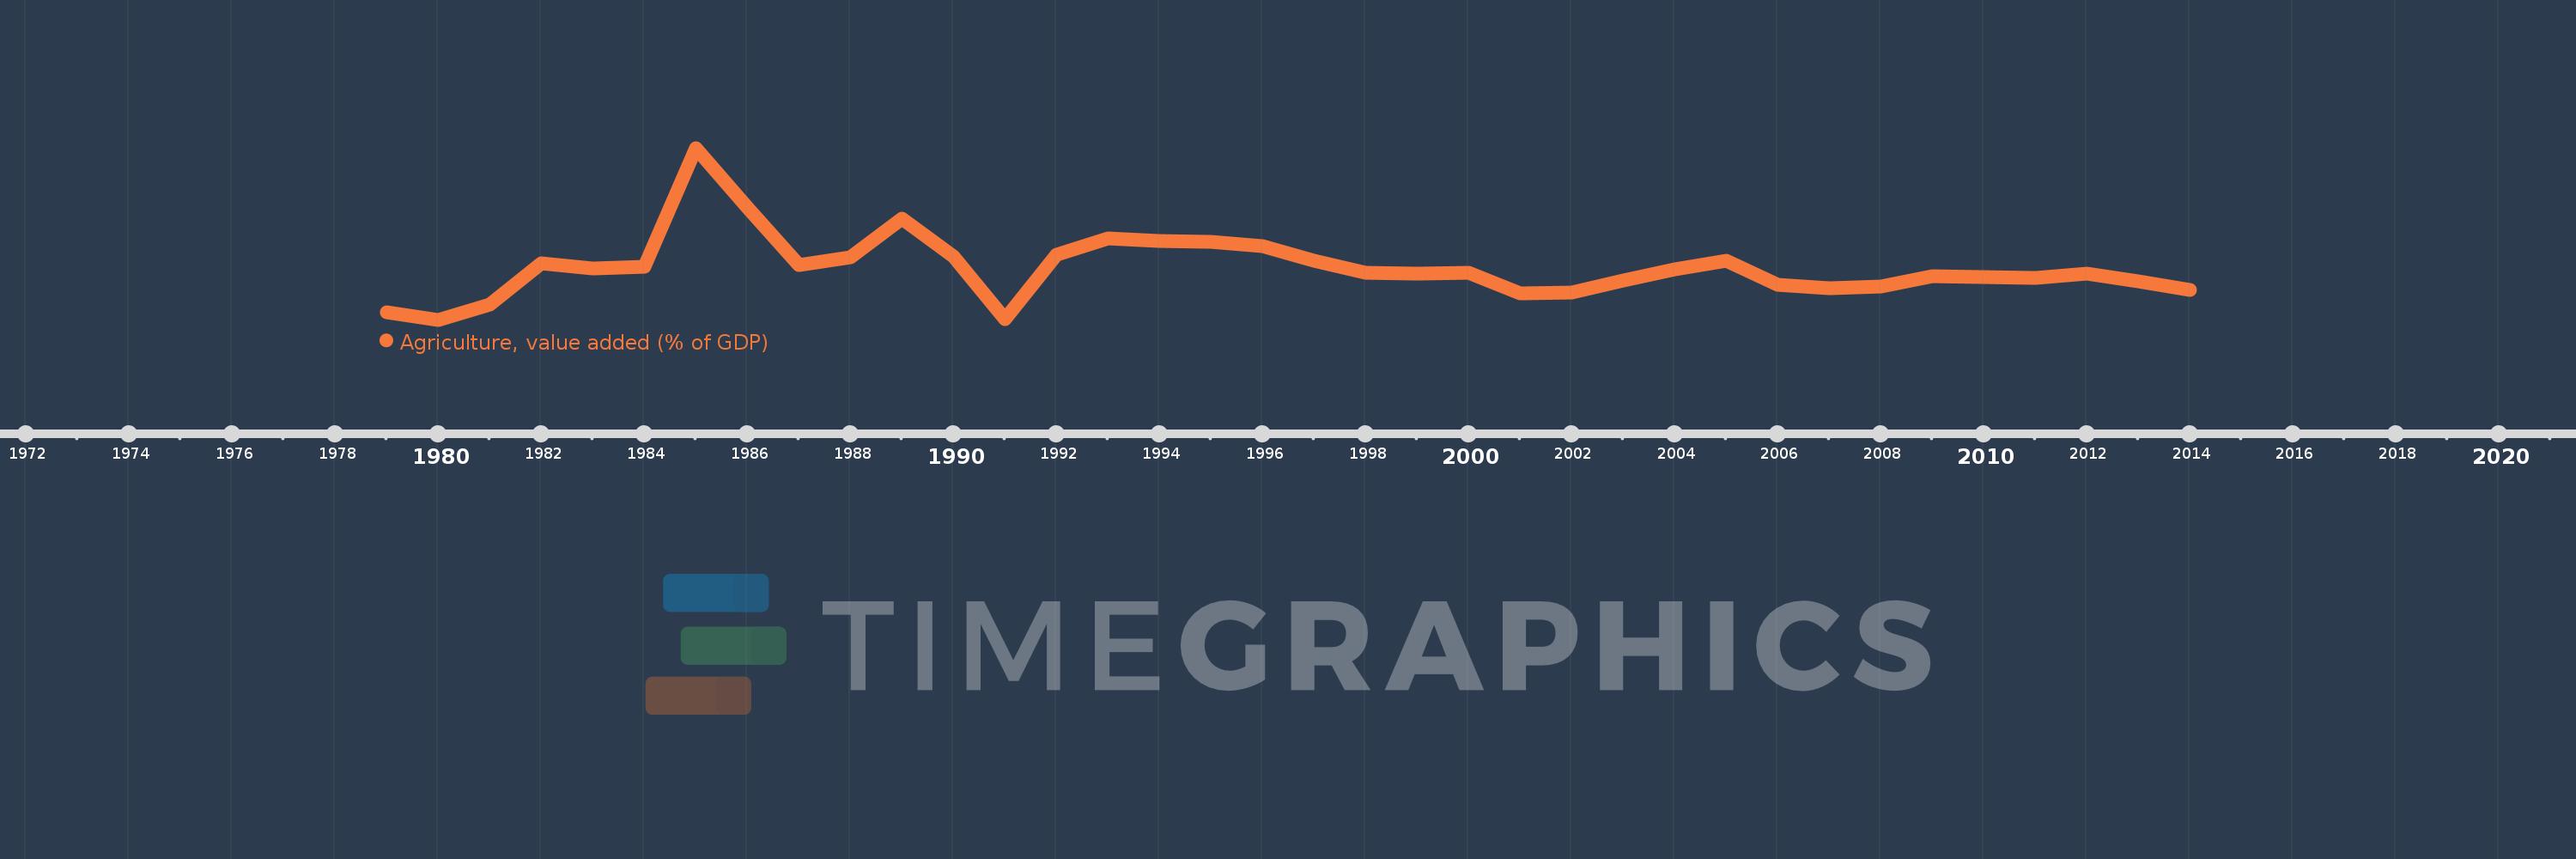
Agriculture, value added (% of GDP)
2014,2013,2012,2011,2010,2009,2008,2007,2006,2005,2004,2003,2002,2001,2000,1999,1998,1997,1996,1995,1994,1993,1992,1991,1990,1989,1988,1987,1986,1985,1984,1983,1982,1981,1980,1979
Estas estadísticas en otros países:
AfghanistanAlbaniaAlgeriaAndorraAngolaAntigua and BarbudaArab WorldArgentinaArmeniaArubaAustraliaAustriaAzerbaijanBahamas, TheBahrainBangladeshBarbadosBelarusBelgiumBelizeBeninBermudaBhutanBoliviaBosnia and HerzegovinaBotswanaBrazilBrunei DarussalamBulgariaBurkina FasoBurundiCabo VerdeCambodiaCameroonCanadaCaribbean small statesCayman IslandsCentral African RepublicCentral Europe and the BalticsChadChileChinaColombiaComorosCongo, Dem. Rep.Congo, Rep.Costa RicaCote d'IvoireCroatiaCubaCyprusCzech RepublicDenmarkDjiboutiDominicaDominican RepublicEarly-demographic dividendEast Asia & PacificEast Asia & Pacific (excluding high income)East Asia & Pacific (IDA & IBRD countries)EcuadorEgypt, Arab Rep.El SalvadorEquatorial GuineaEritreaEstoniaEthiopiaEuro areaEurope & Central AsiaEurope & Central Asia (excluding high income)Europe & Central Asia (IDA & IBRD countries)European UnionFijiFinlandFragile and conflict affected situationsFranceFrench PolynesiaGabonGambia, TheGeorgiaGermanyGhanaGreeceGrenadaGuatemalaGuineaGuinea-BissauGuyanaHeavily indebted poor countries (HIPC)High incomeHondurasHong Kong SAR, ChinaHungaryIBRD onlyIcelandIDA & IBRD totalIDA blendIDA onlyIDA totalIndiaIndonesiaIran, Islamic Rep.IrelandItalyJamaicaJapanJordanKazakhstanKenyaKiribatiKorea, Rep.KosovoKuwaitKyrgyz RepublicLao PDRLate-demographic dividendLatin America & Caribbean Latin America & Caribbean (excluding high income)Latin America & the Caribbean (IDA & IBRD countries)LatviaLeast developed countries: UN classificationLebanonLesothoLibyaLithuaniaLow & middle incomeLow incomeLower middle incomeLuxembourgMacao SAR, ChinaMacedonia, FYRMadagascarMalawiMalaysiaMaldivesMaliMaltaMarshall IslandsMauritaniaMauritiusMexicoMicronesia, Fed. Sts.Middle East & North AfricaMiddle East & North Africa (excluding high income)Middle East & North Africa (IDA & IBRD countries)Middle incomeMoldovaMongoliaMontenegroMoroccoMozambiqueMyanmarNamibiaNepalNetherlandsNew CaledoniaNew ZealandNicaraguaNigerNigeriaNorth AmericaNorwayOECD membersOmanOther small statesPacific island small statesPakistanPalauPanamaPapua New GuineaParaguayPeruPhilippinesPolandPortugalPost-demographic dividendPre-demographic dividendPuerto RicoQatarRomaniaRussian FederationRwandaSao Tome and PrincipeSaudi ArabiaSenegalSerbiaSeychellesSierra LeoneSingaporeSlovak RepublicSloveniaSmall statesSolomon IslandsSomaliaSouth AfricaSouth AsiaSouth Asia (IDA & IBRD)SpainSri LankaSt. Kitts and NevisSt. LuciaSt. Vincent and the GrenadinesSub-Saharan Africa Sub-Saharan Africa (excluding high income)Sub-Saharan Africa (IDA & IBRD countries)SudanSurinameSwazilandSwedenSwitzerlandSyrian Arab RepublicTajikistanTanzaniaThailandTimor-LesteTogoTongaTrinidad and TobagoTunisiaTurkeyTurkmenistanTuvaluUgandaUkraineUnited KingdomUnited StatesUpper middle incomeUruguayUzbekistanVanuatuVenezuela, RBVietnamWest Bank and GazaWorldYemen, Rep.ZambiaZimbabwe línea de tiempo (timeline):
En esta escala de tiempo se presenta un gráfico de 1979 y 2014 de Kiribati. Los datos de 1978 están ausentes. El número de observaciones reales por fecha: 36.
Fuente (nombre):
Indicadores del desarrollo mundial
Fuente (organización):
World Bank national accounts data, and OECD National Accounts data files.
Categorías:
Agriculture & Rural Development, Economy & Growth, Climate Change
Se ha actualizado:
23 abr 2017 año
Los indicadores de los cambios de valor en los últimos años
Mínimo:
18.502
1 ene 1980 año
Máximo:
44.35
1 ene 1985 año
A la fecha de observación
Valor
Cambio absoluto
El cambio con respecto al valor anterior
1 ene 1979 año
19.624
+19.624
0.0%
1 ene 1980 año
18.502
-1.121
-5.71%
1 ene 1981 año
20.744
+2.241
12.11%
1 ene 1982 año
26.938
+6.194
29.86%
1 ene 1983 año
26.215
-0.722
-2.68%
1 ene 1984 año
26.483
+0.268
1.02%
1 ene 1985 año
44.35
+17.866
67.46%
1 ene 1986 año
35.376
-8.973
-20.23%
1 ene 1987 año
26.758
-8.619
-24.36%
1 ene 1988 año
27.89
+1.132
4.23%
1 ene 1989 año
33.735
+5.845
20.96%
1 ene 1990 año
28.084
-5.651
-16.75%
1 ene 1991 año
18.602
-9.481
-33.76%
1 ene 1992 año
28.33
+9.728
52.29%
1 ene 1993 año
30.757
+2.427
8.57%
1 ene 1994 año
30.348
-0.409
-1.33%
1 ene 1995 año
30.243
-0.104
-0.34%
1 ene 1996 año
29.534
-0.709
-2.35%
1 ene 1997 año
27.37
-2.164
-7.33%
1 ene 1998 año
25.578
-1.793
-6.55%
1 ene 1999 año
25.497
-0.081
-0.32%
1 ene 2000 año
25.634
+0.137
0.54%
1 ene 2001 año
22.492
-3.142
-12.26%
1 ene 2002 año
22.584
+0.092
0.41%
1 ene 2003 año
24.431
+1.847
8.18%
1 ene 2004 año
26.083
+1.653
6.76%
1 ene 2005 año
27.337
+1.254
4.81%
1 ene 2006 año
23.703
-3.634
-13.29%
1 ene 2007 año
23.214
-0.489
-2.06%
1 ene 2008 año
23.483
+0.269
1.16%
1 ene 2009 año
25.063
+1.58
6.73%
1 ene 2010 año
24.869
-0.194
-0.77%
1 ene 2011 año
24.785
-0.084
-0.34%
1 ene 2012 año
25.479
+0.694
2.8%
1 ene 2013 año
24.275
-1.204
-4.73%
1 ene 2014 año
23.013
-1.263
-5.2%
Ranking de los países por los datos estadísticos actuales


Comentarios: