29
/es/
es
AIzaSyAYiBZKx7MnpbEhh9jyipgxe19OcubqV5w
April 1, 2024
177322
Lesotho
LSO
true
2
1
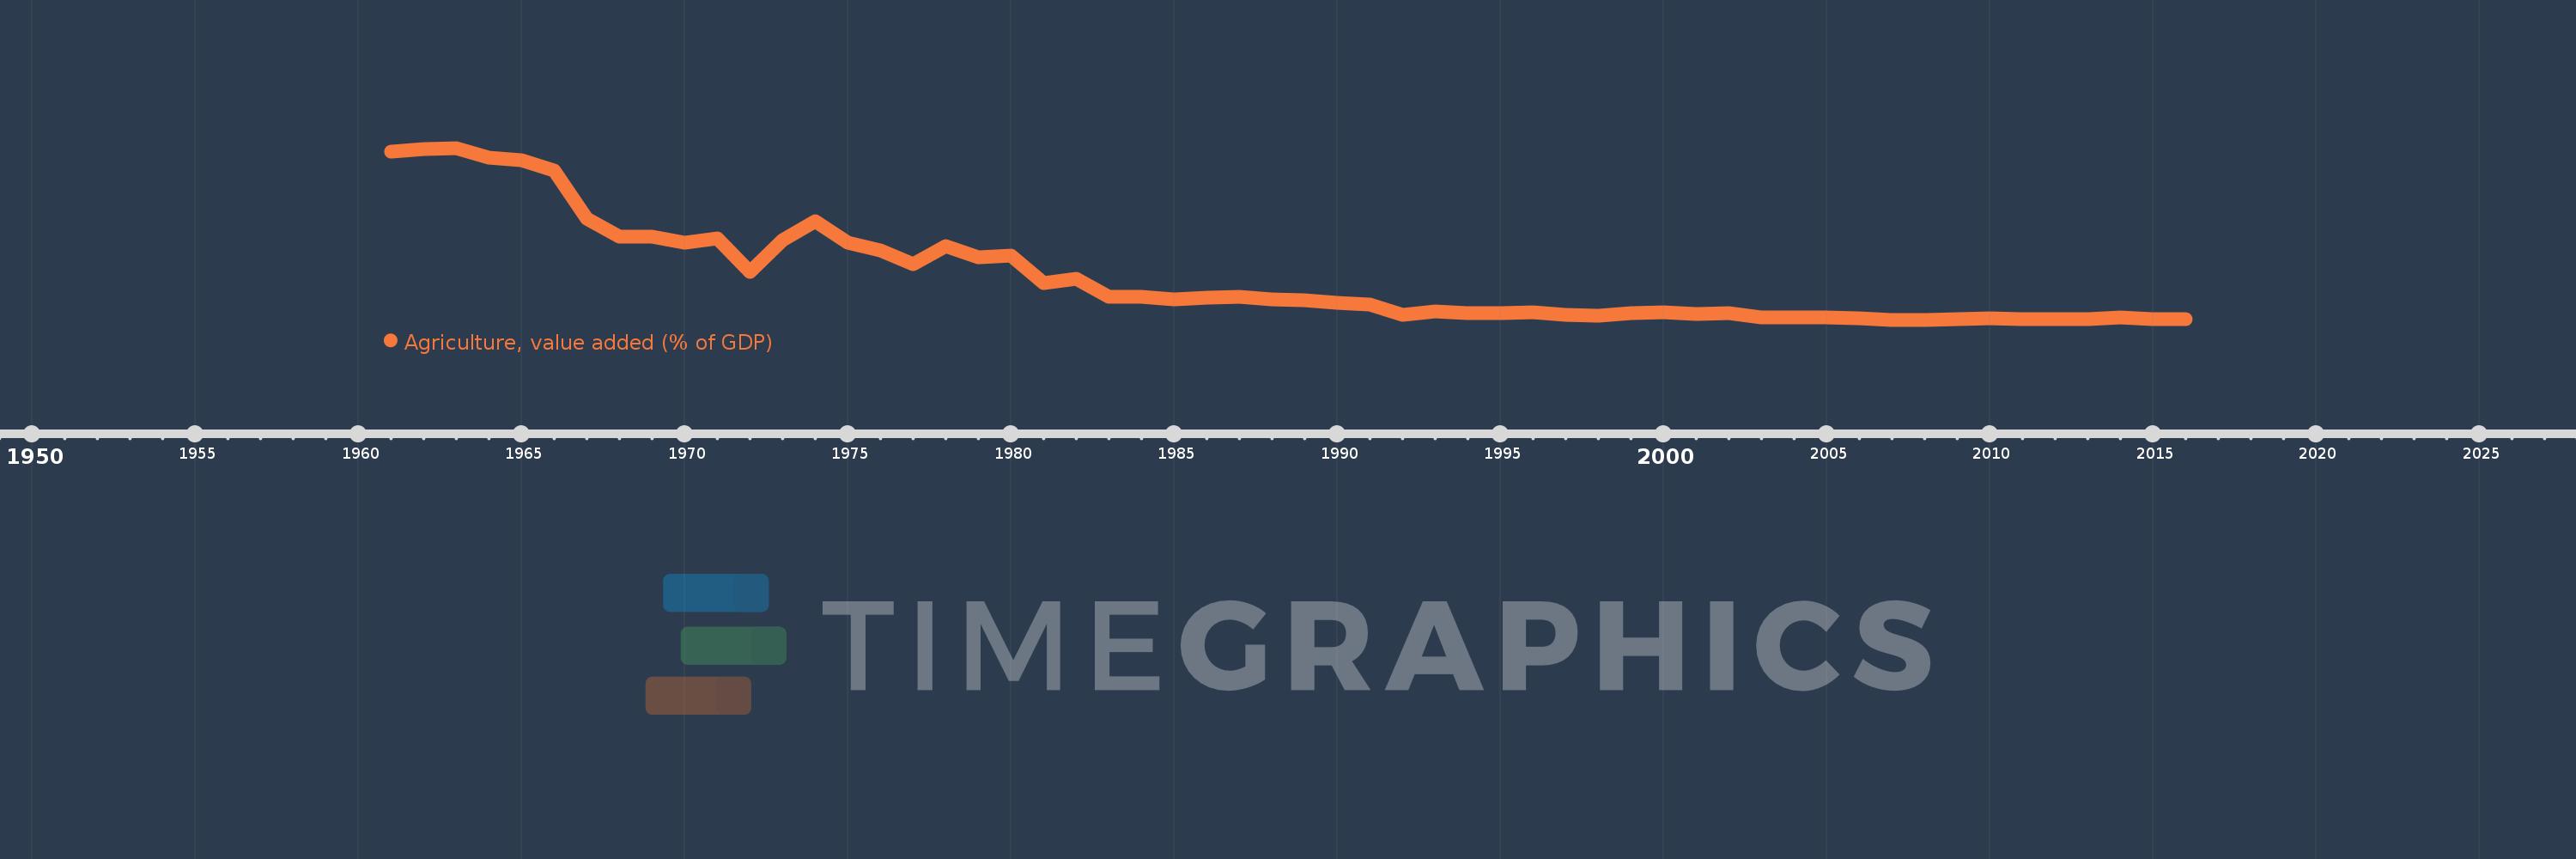
Agriculture, value added (% of GDP)
2016,2015,2014,2013,2012,2011,2010,2009,2008,2007,2006,2005,2004,2003,2002,2001,2000,1999,1998,1997,1996,1995,1994,1993,1992,1991,1990,1989,1988,1987,1986,1985,1984,1983,1982,1981,1980,1979,1978,1977,1976,1975,1974,1973,1972,1971,1970,1969,1968,1967,1966,1965,1964,1963,1962,1961
Estas estadísticas en otros países:
AfghanistanAlbaniaAlgeriaAndorraAngolaAntigua and BarbudaArab WorldArgentinaArmeniaArubaAustraliaAustriaAzerbaijanBahamas, TheBahrainBangladeshBarbadosBelarusBelgiumBelizeBeninBermudaBhutanBoliviaBosnia and HerzegovinaBotswanaBrazilBrunei DarussalamBulgariaBurkina FasoBurundiCabo VerdeCambodiaCameroonCanadaCaribbean small statesCayman IslandsCentral African RepublicCentral Europe and the BalticsChadChileChinaColombiaComorosCongo, Dem. Rep.Congo, Rep.Costa RicaCote d'IvoireCroatiaCubaCyprusCzech RepublicDenmarkDjiboutiDominicaDominican RepublicEarly-demographic dividendEast Asia & PacificEast Asia & Pacific (excluding high income)East Asia & Pacific (IDA & IBRD countries)EcuadorEgypt, Arab Rep.El SalvadorEquatorial GuineaEritreaEstoniaEthiopiaEuro areaEurope & Central AsiaEurope & Central Asia (excluding high income)Europe & Central Asia (IDA & IBRD countries)European UnionFijiFinlandFragile and conflict affected situationsFranceFrench PolynesiaGabonGambia, TheGeorgiaGermanyGhanaGreeceGrenadaGuatemalaGuineaGuinea-BissauGuyanaHeavily indebted poor countries (HIPC)High incomeHondurasHong Kong SAR, ChinaHungaryIBRD onlyIcelandIDA & IBRD totalIDA blendIDA onlyIDA totalIndiaIndonesiaIran, Islamic Rep.IrelandItalyJamaicaJapanJordanKazakhstanKenyaKiribatiKorea, Rep.KosovoKuwaitKyrgyz RepublicLao PDRLate-demographic dividendLatin America & Caribbean Latin America & Caribbean (excluding high income)Latin America & the Caribbean (IDA & IBRD countries)LatviaLeast developed countries: UN classificationLebanonLesothoLibyaLithuaniaLow & middle incomeLow incomeLower middle incomeLuxembourgMacao SAR, ChinaMacedonia, FYRMadagascarMalawiMalaysiaMaldivesMaliMaltaMarshall IslandsMauritaniaMauritiusMexicoMicronesia, Fed. Sts.Middle East & North AfricaMiddle East & North Africa (excluding high income)Middle East & North Africa (IDA & IBRD countries)Middle incomeMoldovaMongoliaMontenegroMoroccoMozambiqueMyanmarNamibiaNepalNetherlandsNew CaledoniaNew ZealandNicaraguaNigerNigeriaNorth AmericaNorwayOECD membersOmanOther small statesPacific island small statesPakistanPalauPanamaPapua New GuineaParaguayPeruPhilippinesPolandPortugalPost-demographic dividendPre-demographic dividendPuerto RicoQatarRomaniaRussian FederationRwandaSao Tome and PrincipeSaudi ArabiaSenegalSerbiaSeychellesSierra LeoneSingaporeSlovak RepublicSloveniaSmall statesSolomon IslandsSomaliaSouth AfricaSouth AsiaSouth Asia (IDA & IBRD)SpainSri LankaSt. Kitts and NevisSt. LuciaSt. Vincent and the GrenadinesSub-Saharan Africa Sub-Saharan Africa (excluding high income)Sub-Saharan Africa (IDA & IBRD countries)SudanSurinameSwazilandSwedenSwitzerlandSyrian Arab RepublicTajikistanTanzaniaThailandTimor-LesteTogoTongaTrinidad and TobagoTunisiaTurkeyTurkmenistanTuvaluUgandaUkraineUnited KingdomUnited StatesUpper middle incomeUruguayUzbekistanVanuatuVenezuela, RBVietnamWest Bank and GazaWorldYemen, Rep.ZambiaZimbabwe línea de tiempo (timeline):
En esta escala de tiempo se presenta un gráfico de 1961 y 2016 de Lesotho. Los datos de 1960 están ausentes. El número de observaciones reales por fecha: 56.
Fuente (nombre):
Indicadores del desarrollo mundial
Fuente (organización):
World Bank national accounts data, and OECD National Accounts data files.
Categorías:
Agriculture & Rural Development, Economy & Growth, Climate Change
Se ha actualizado:
23 abr 2017 año
Los indicadores de los cambios de valor en los últimos años
Mínimo:
5.475
1 ene 2008 año
Máximo:
94.846
1 ene 1963 año
A la fecha de observación
Valor
Cambio absoluto
El cambio con respecto al valor anterior
1 ene 1961 año
93.084
+93.084
0.0%
1 ene 1962 año
94.218
+1.134
1.22%
1 ene 1963 año
94.846
+0.629
0.67%
1 ene 1964 año
89.651
-5.195
-5.48%
1 ene 1965 año
88.385
-1.266
-1.41%
1 ene 1966 año
83.102
-5.283
-5.98%
1 ene 1967 año
57.929
-25.173
-30.29%
1 ene 1968 año
48.564
-9.365
-16.17%
1 ene 1969 año
48.886
+0.322
0.66%
1 ene 1970 año
45.765
-3.121
-6.38%
1 ene 1971 año
47.91
+2.146
4.69%
1 ene 1972 año
30.388
-17.522
-36.57%
1 ene 1973 año
46.929
+16.54
54.43%
1 ene 1974 año
56.902
+9.974
21.25%
1 ene 1975 año
45.626
-11.277
-19.82%
1 ene 1976 año
41.457
-4.169
-9.14%
1 ene 1977 año
34.608
-6.849
-16.52%
1 ene 1978 año
43.723
+9.115
26.34%
1 ene 1979 año
37.904
-5.818
-13.31%
1 ene 1980 año
38.834
+0.93
2.45%
1 ene 1981 año
24.611
-14.223
-36.63%
1 ene 1982 año
26.81
+2.2
8.94%
1 ene 1983 año
17.282
-9.528
-35.54%
1 ene 1984 año
17.417
+0.135
0.78%
1 ene 1985 año
16.286
-1.131
-6.49%
1 ene 1986 año
17.132
+0.846
5.19%
1 ene 1987 año
17.431
+0.299
1.74%
1 ene 1988 año
15.917
-1.514
-8.69%
1 ene 1989 año
15.522
-0.395
-2.48%
1 ene 1990 año
14.107
-1.415
-9.11%
1 ene 1991 año
13.598
-0.51
-3.61%
1 ene 1992 año
8.047
-5.551
-40.82%
1 ene 1993 año
9.882
+1.835
22.81%
1 ene 1994 año
9.006
-0.877
-8.87%
1 ene 1995 año
8.85
-0.155
-1.73%
1 ene 1996 año
9.455
+0.604
6.83%
1 ene 1997 año
8.111
-1.343
-14.21%
1 ene 1998 año
7.524
-0.587
-7.24%
1 ene 1999 año
8.883
+1.359
18.06%
1 ene 2000 año
9.312
+0.428
4.82%
1 ene 2001 año
8.299
-1.012
-10.87%
1 ene 2002 año
8.776
+0.477
5.74%
1 ene 2003 año
6.789
-1.987
-22.64%
1 ene 2004 año
6.895
+0.106
1.56%
1 ene 2005 año
6.697
-0.198
-2.87%
1 ene 2006 año
6.421
-0.276
-4.12%
1 ene 2007 año
5.517
-0.904
-14.08%
1 ene 2008 año
5.475
-0.043
-0.77%
1 ene 2009 año
5.805
+0.331
6.04%
1 ene 2010 año
6.271
+0.465
8.02%
1 ene 2011 año
5.793
-0.478
-7.62%
1 ene 2012 año
5.83
+0.037
0.64%
1 ene 2013 año
5.637
-0.193
-3.31%
1 ene 2014 año
6.611
+0.974
17.28%
1 ene 2015 año
5.895
-0.715
-10.82%
1 ene 2016 año
5.669
-0.226
-3.83%
Ranking de los países por los datos estadísticos actuales


Comentarios: