29
/es/
es
AIzaSyAYiBZKx7MnpbEhh9jyipgxe19OcubqV5w
April 1, 2024
280598
Venezuela, RB
VEN
true
2
1
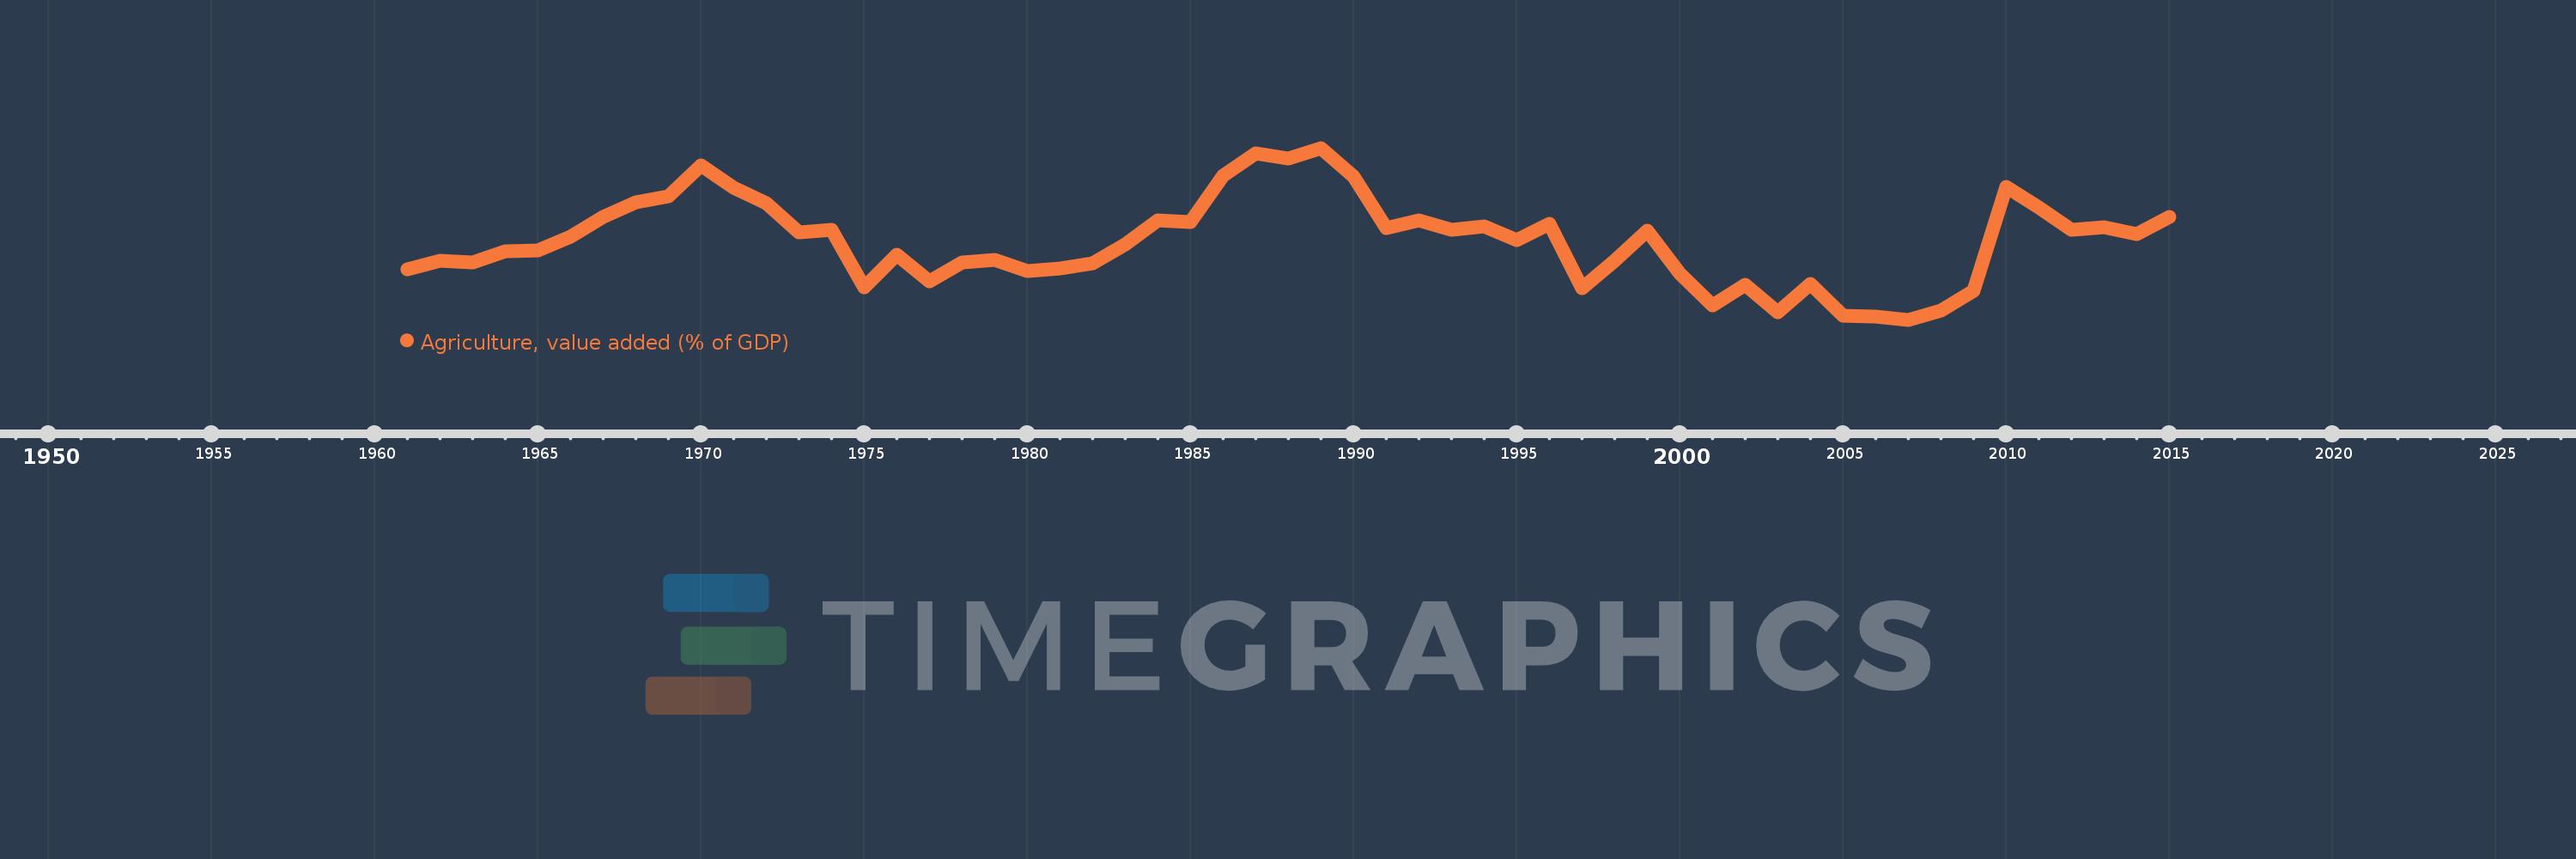
Agriculture, value added (% of GDP)
2015,2014,2013,2012,2011,2010,2009,2008,2007,2006,2005,2004,2003,2002,2001,2000,1999,1998,1997,1996,1995,1994,1993,1992,1991,1990,1989,1988,1987,1986,1985,1984,1983,1982,1981,1980,1979,1978,1977,1976,1975,1974,1973,1972,1971,1970,1969,1968,1967,1966,1965,1964,1963,1962,1961
Estas estadísticas en otros países:
AfghanistanAlbaniaAlgeriaAndorraAngolaAntigua and BarbudaArab WorldArgentinaArmeniaArubaAustraliaAustriaAzerbaijanBahamas, TheBahrainBangladeshBarbadosBelarusBelgiumBelizeBeninBermudaBhutanBoliviaBosnia and HerzegovinaBotswanaBrazilBrunei DarussalamBulgariaBurkina FasoBurundiCabo VerdeCambodiaCameroonCanadaCaribbean small statesCayman IslandsCentral African RepublicCentral Europe and the BalticsChadChileChinaColombiaComorosCongo, Dem. Rep.Congo, Rep.Costa RicaCote d'IvoireCroatiaCubaCyprusCzech RepublicDenmarkDjiboutiDominicaDominican RepublicEarly-demographic dividendEast Asia & PacificEast Asia & Pacific (excluding high income)East Asia & Pacific (IDA & IBRD countries)EcuadorEgypt, Arab Rep.El SalvadorEquatorial GuineaEritreaEstoniaEthiopiaEuro areaEurope & Central AsiaEurope & Central Asia (excluding high income)Europe & Central Asia (IDA & IBRD countries)European UnionFijiFinlandFragile and conflict affected situationsFranceFrench PolynesiaGabonGambia, TheGeorgiaGermanyGhanaGreeceGrenadaGuatemalaGuineaGuinea-BissauGuyanaHeavily indebted poor countries (HIPC)High incomeHondurasHong Kong SAR, ChinaHungaryIBRD onlyIcelandIDA & IBRD totalIDA blendIDA onlyIDA totalIndiaIndonesiaIran, Islamic Rep.IrelandItalyJamaicaJapanJordanKazakhstanKenyaKiribatiKorea, Rep.KosovoKuwaitKyrgyz RepublicLao PDRLate-demographic dividendLatin America & Caribbean Latin America & Caribbean (excluding high income)Latin America & the Caribbean (IDA & IBRD countries)LatviaLeast developed countries: UN classificationLebanonLesothoLibyaLithuaniaLow & middle incomeLow incomeLower middle incomeLuxembourgMacao SAR, ChinaMacedonia, FYRMadagascarMalawiMalaysiaMaldivesMaliMaltaMarshall IslandsMauritaniaMauritiusMexicoMicronesia, Fed. Sts.Middle East & North AfricaMiddle East & North Africa (excluding high income)Middle East & North Africa (IDA & IBRD countries)Middle incomeMoldovaMongoliaMontenegroMoroccoMozambiqueMyanmarNamibiaNepalNetherlandsNew CaledoniaNew ZealandNicaraguaNigerNigeriaNorth AmericaNorwayOECD membersOmanOther small statesPacific island small statesPakistanPalauPanamaPapua New GuineaParaguayPeruPhilippinesPolandPortugalPost-demographic dividendPre-demographic dividendPuerto RicoQatarRomaniaRussian FederationRwandaSao Tome and PrincipeSaudi ArabiaSenegalSerbiaSeychellesSierra LeoneSingaporeSlovak RepublicSloveniaSmall statesSolomon IslandsSomaliaSouth AfricaSouth AsiaSouth Asia (IDA & IBRD)SpainSri LankaSt. Kitts and NevisSt. LuciaSt. Vincent and the GrenadinesSub-Saharan Africa Sub-Saharan Africa (excluding high income)Sub-Saharan Africa (IDA & IBRD countries)SudanSurinameSwazilandSwedenSwitzerlandSyrian Arab RepublicTajikistanTanzaniaThailandTimor-LesteTogoTongaTrinidad and TobagoTunisiaTurkeyTurkmenistanTuvaluUgandaUkraineUnited KingdomUnited StatesUpper middle incomeUruguayUzbekistanVanuatuVenezuela, RBVietnamWest Bank and GazaWorldYemen, Rep.ZambiaZimbabwe línea de tiempo (timeline):
En esta escala de tiempo se presenta un gráfico de 1961 y 2015 de Venezuela, RB. Los datos de 1960 están ausentes. El número de observaciones reales por fecha: 55.
Fuente (nombre):
Indicadores del desarrollo mundial
Fuente (organización):
World Bank national accounts data, and OECD National Accounts data files.
Categorías:
Agriculture & Rural Development, Economy & Growth, Climate Change
Se ha actualizado:
23 abr 2017 año
Los indicadores de los cambios de valor en los últimos años
Mínimo:
3.978
1 ene 2007 año
Máximo:
6.757
1 ene 1989 año
A la fecha de observación
Valor
Cambio absoluto
El cambio con respecto al valor anterior
1 ene 1961 año
4.795
+4.795
0.0%
1 ene 1962 año
4.935
+0.14
2.92%
1 ene 1963 año
4.903
-0.032
-0.65%
1 ene 1964 año
5.08
+0.177
3.62%
1 ene 1965 año
5.098
+0.018
0.36%
1 ene 1966 año
5.321
+0.223
4.37%
1 ene 1967 año
5.643
+0.321
6.04%
1 ene 1968 año
5.876
+0.233
4.13%
1 ene 1969 año
5.972
+0.095
1.62%
1 ene 1970 año
6.472
+0.501
8.38%
1 ene 1971 año
6.109
-0.363
-5.61%
1 ene 1972 año
5.865
-0.244
-4.0%
1 ene 1973 año
5.387
-0.478
-8.15%
1 ene 1974 año
5.434
+0.047
0.87%
1 ene 1975 año
4.503
-0.93
-17.12%
1 ene 1976 año
5.032
+0.529
11.75%
1 ene 1977 año
4.602
-0.43
-8.55%
1 ene 1978 año
4.899
+0.297
6.45%
1 ene 1979 año
4.944
+0.045
0.93%
1 ene 1980 año
4.772
-0.173
-3.49%
1 ene 1981 año
4.802
+0.03
0.64%
1 ene 1982 año
4.897
+0.095
1.98%
1 ene 1983 año
5.203
+0.306
6.25%
1 ene 1984 año
5.587
+0.385
7.39%
1 ene 1985 año
5.556
-0.031
-0.55%
1 ene 1986 año
6.306
+0.749
13.48%
1 ene 1987 año
6.674
+0.368
5.84%
1 ene 1988 año
6.583
-0.091
-1.37%
1 ene 1989 año
6.757
+0.174
2.65%
1 ene 1990 año
6.298
-0.459
-6.79%
1 ene 1991 año
5.466
-0.832
-13.22%
1 ene 1992 año
5.579
+0.113
2.07%
1 ene 1993 año
5.427
-0.152
-2.72%
1 ene 1994 año
5.486
+0.059
1.09%
1 ene 1995 año
5.265
-0.222
-4.04%
1 ene 1996 año
5.526
+0.261
4.95%
1 ene 1997 año
4.491
-1.035
-18.73%
1 ene 1998 año
4.93
+0.439
9.77%
1 ene 1999 año
5.42
+0.491
9.95%
1 ene 2000 año
4.726
-0.694
-12.81%
1 ene 2001 año
4.21
-0.516
-10.91%
1 ene 2002 año
4.544
+0.334
7.94%
1 ene 2003 año
4.103
-0.441
-9.7%
1 ene 2004 año
4.556
+0.452
11.02%
1 ene 2005 año
4.037
-0.518
-11.37%
1 ene 2006 año
4.023
-0.015
-0.36%
1 ene 2007 año
3.978
-0.045
-1.12%
1 ene 2008 año
4.125
+0.147
3.7%
1 ene 2009 año
4.444
+0.319
7.74%
1 ene 2010 año
6.129
+1.685
37.9%
1 ene 2011 año
5.791
-0.337
-5.51%
1 ene 2012 año
5.432
-0.359
-6.2%
1 ene 2013 año
5.471
+0.039
0.71%
1 ene 2014 año
5.368
-0.103
-1.88%
1 ene 2015 año
5.642
+0.274
5.11%
Ranking de los países por los datos estadísticos actuales


Comentarios: