29
/es/
es
AIzaSyAYiBZKx7MnpbEhh9jyipgxe19OcubqV5w
April 1, 2024
63932
Afghanistan
AFG
true
2
1
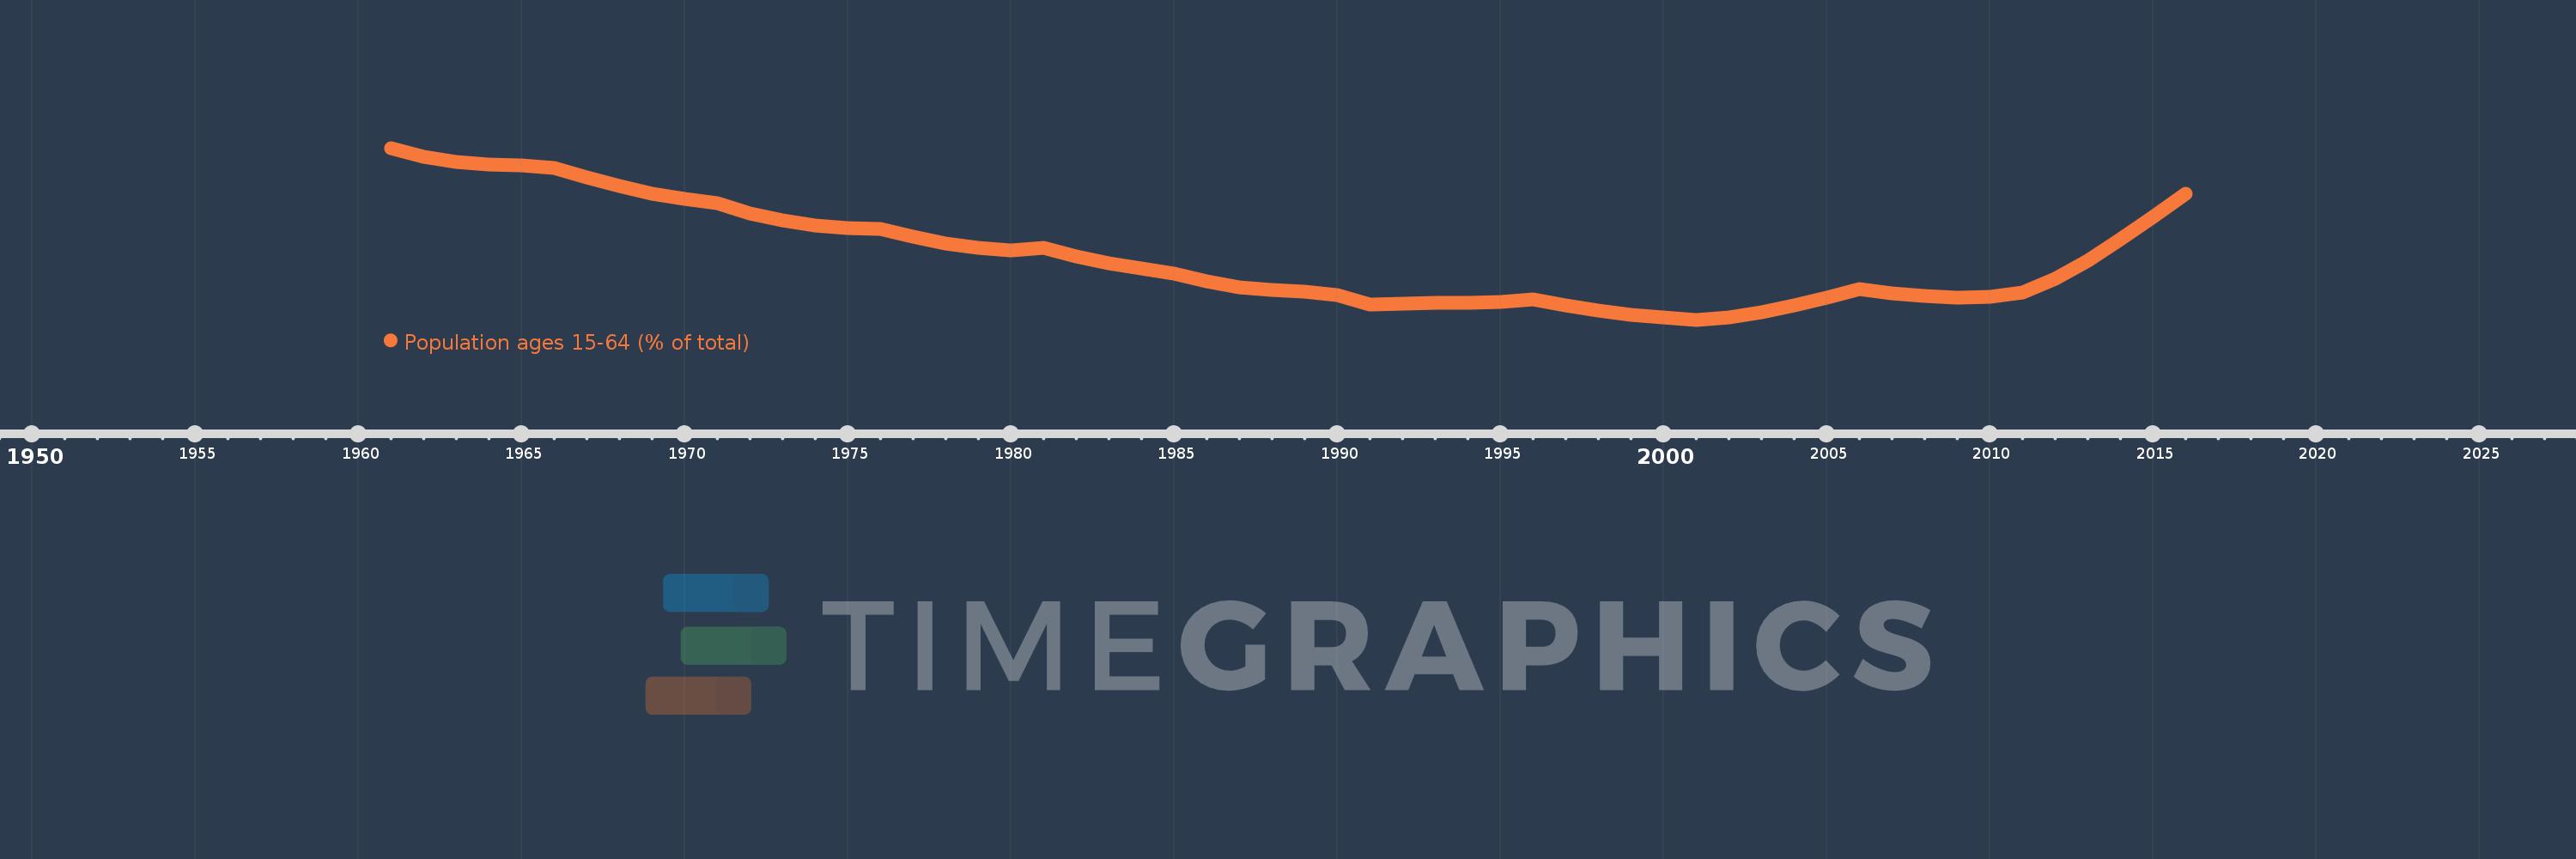
Population ages 15-64 (% of total)
2016,2015,2014,2013,2012,2011,2010,2009,2008,2007,2006,2005,2004,2003,2002,2001,2000,1999,1998,1997,1996,1995,1994,1993,1992,1991,1990,1989,1988,1987,1986,1985,1984,1983,1982,1981,1980,1979,1978,1977,1976,1975,1974,1973,1972,1971,1970,1969,1968,1967,1966,1965,1964,1963,1962,1961
Estas estadísticas en otros países:
AfghanistanAlbaniaAlgeriaAngolaAntigua and BarbudaArab WorldArgentinaArmeniaArubaAustraliaAustriaAzerbaijanBahamas, TheBahrainBangladeshBarbadosBelarusBelgiumBelizeBeninBhutanBoliviaBosnia and HerzegovinaBotswanaBrazilBrunei DarussalamBulgariaBurkina FasoBurundiCabo VerdeCambodiaCameroonCanadaCaribbean small statesCentral African RepublicCentral Europe and the BalticsChadChannel IslandsChileChinaColombiaComorosCongo, Dem. Rep.Congo, Rep.Costa RicaCote d'IvoireCroatiaCubaCuracaoCyprusCzech RepublicDenmarkDjiboutiDominican RepublicEarly-demographic dividendEast Asia & PacificEast Asia & Pacific (excluding high income)East Asia & Pacific (IDA & IBRD countries)EcuadorEgypt, Arab Rep.El SalvadorEquatorial GuineaEritreaEstoniaEthiopiaEuro areaEurope & Central AsiaEurope & Central Asia (excluding high income)Europe & Central Asia (IDA & IBRD countries)European UnionFijiFinlandFragile and conflict affected situationsFranceFrench PolynesiaGabonGambia, TheGeorgiaGermanyGhanaGreeceGrenadaGuamGuatemalaGuineaGuinea-BissauGuyanaHaitiHeavily indebted poor countries (HIPC)High incomeHondurasHong Kong SAR, ChinaHungaryIBRD onlyIcelandIDA & IBRD totalIDA blendIDA onlyIDA totalIndiaIndonesiaIran, Islamic Rep.IraqIrelandIsraelItalyJamaicaJapanJordanKazakhstanKenyaKiribatiKorea, Dem. People’s Rep.Korea, Rep.KosovoKuwaitKyrgyz RepublicLao PDRLate-demographic dividendLatin America & Caribbean Latin America & Caribbean (excluding high income)Latin America & the Caribbean (IDA & IBRD countries)LatviaLeast developed countries: UN classificationLebanonLesothoLiberiaLibyaLithuaniaLow & middle incomeLow incomeLower middle incomeLuxembourgMacao SAR, ChinaMacedonia, FYRMadagascarMalawiMalaysiaMaldivesMaliMaltaMauritaniaMauritiusMexicoMicronesia, Fed. Sts.Middle East & North AfricaMiddle East & North Africa (excluding high income)Middle East & North Africa (IDA & IBRD countries)Middle incomeMoldovaMongoliaMontenegroMoroccoMozambiqueMyanmarNamibiaNepalNetherlandsNew CaledoniaNew ZealandNicaraguaNigerNigeriaNorth AmericaNorwayOECD membersOmanOther small statesPacific island small statesPakistanPanamaPapua New GuineaParaguayPeruPhilippinesPolandPortugalPost-demographic dividendPre-demographic dividendPuerto RicoQatarRomaniaRussian FederationRwandaSamoaSao Tome and PrincipeSaudi ArabiaSenegalSerbiaSeychellesSierra LeoneSingaporeSlovak RepublicSloveniaSmall statesSolomon IslandsSomaliaSouth AfricaSouth AsiaSouth Asia (IDA & IBRD)South SudanSpainSri LankaSt. LuciaSt. Vincent and the GrenadinesSub-Saharan Africa Sub-Saharan Africa (excluding high income)Sub-Saharan Africa (IDA & IBRD countries)SudanSurinameSwazilandSwedenSwitzerlandSyrian Arab RepublicTajikistanTanzaniaThailandTimor-LesteTogoTongaTrinidad and TobagoTunisiaTurkeyTurkmenistanUgandaUkraineUnited Arab EmiratesUnited KingdomUnited StatesUpper middle incomeUruguayUzbekistanVanuatuVenezuela, RBVietnamVirgin Islands (U.S.)West Bank and GazaWorldYemen, Rep.ZambiaZimbabwe línea de tiempo (timeline):
En esta escala de tiempo se presenta un gráfico de 1961 y 2016 de Afghanistan. Los datos de 1960 están ausentes. El número de observaciones reales por fecha: 56.
Fuente (nombre):
Indicadores del desarrollo mundial
Fuente (organización):
World Bank staff estimates based on age distributions of United Nations Population Division's World Population Prospects.
Categorías:
Education, Health
Se ha actualizado:
23 abr 2017 año
Los indicadores de los cambios de valor en los últimos años
Mínimo:
49.199
1 ene 2001 año
Máximo:
55.03
1 ene 1961 año
A la fecha de observación
Valor
Cambio absoluto
El cambio con respecto al valor anterior
1 ene 1961 año
55.03
+55.03
0.0%
1 ene 1962 año
54.718
-0.313
-0.57%
1 ene 1963 año
54.554
-0.164
-0.3%
1 ene 1964 año
54.481
-0.073
-0.13%
1 ene 1965 año
54.426
-0.054
-0.1%
1 ene 1966 año
54.359
-0.067
-0.12%
1 ene 1967 año
54.025
-0.334
-0.61%
1 ene 1968 año
53.733
-0.292
-0.54%
1 ene 1969 año
53.484
-0.249
-0.46%
1 ene 1970 año
53.291
-0.194
-0.36%
1 ene 1971 año
53.156
-0.135
-0.25%
1 ene 1972 año
52.819
-0.337
-0.63%
1 ene 1973 año
52.575
-0.244
-0.46%
1 ene 1974 año
52.407
-0.167
-0.32%
1 ene 1975 año
52.306
-0.101
-0.19%
1 ene 1976 año
52.278
-0.028
-0.05%
1 ene 1977 año
52.011
-0.268
-0.51%
1 ene 1978 año
51.789
-0.222
-0.43%
1 ene 1979 año
51.626
-0.163
-0.32%
1 ene 1980 año
51.559
-0.067
-0.13%
1 ene 1981 año
51.635
+0.076
0.15%
1 ene 1982 año
51.346
-0.289
-0.56%
1 ene 1983 año
51.114
-0.232
-0.45%
1 ene 1984 año
50.931
-0.183
-0.36%
1 ene 1985 año
50.751
-0.181
-0.35%
1 ene 1986 año
50.499
-0.252
-0.5%
1 ene 1987 año
50.301
-0.198
-0.39%
1 ene 1988 año
50.212
-0.089
-0.18%
1 ene 1989 año
50.157
-0.056
-0.11%
1 ene 1990 año
50.031
-0.126
-0.25%
1 ene 1991 año
49.728
-0.303
-0.61%
1 ene 1992 año
49.749
+0.022
0.04%
1 ene 1993 año
49.781
+0.032
0.06%
1 ene 1994 año
49.781
0.0
0.0%
1 ene 1995 año
49.789
+0.008
0.02%
1 ene 1996 año
49.881
+0.092
0.19%
1 ene 1997 año
49.694
-0.187
-0.38%
1 ene 1998 año
49.511
-0.183
-0.37%
1 ene 1999 año
49.373
-0.138
-0.28%
1 ene 2000 año
49.279
-0.094
-0.19%
1 ene 2001 año
49.199
-0.08
-0.16%
1 ene 2002 año
49.277
+0.078
0.16%
1 ene 2003 año
49.452
+0.174
0.35%
1 ene 2004 año
49.68
+0.228
0.46%
1 ene 2005 año
49.938
+0.259
0.52%
1 ene 2006 año
50.231
+0.293
0.59%
1 ene 2007 año
50.107
-0.125
-0.25%
1 ene 2008 año
50.0
-0.107
-0.21%
1 ene 2009 año
49.946
-0.054
-0.11%
1 ene 2010 año
49.985
+0.039
0.08%
1 ene 2011 año
50.135
+0.151
0.3%
1 ene 2012 año
50.59
+0.454
0.91%
1 ene 2013 año
51.2
+0.61
1.21%
1 ene 2014 año
51.92
+0.72
1.41%
1 ene 2015 año
52.694
+0.774
1.49%
1 ene 2016 año
53.489
+0.795
1.51%
Ranking de los países por los datos estadísticos actuales


Comentarios: