29
/es/
es
AIzaSyAYiBZKx7MnpbEhh9jyipgxe19OcubqV5w
April 1, 2024
126697
El Salvador
SLV
true
2
1
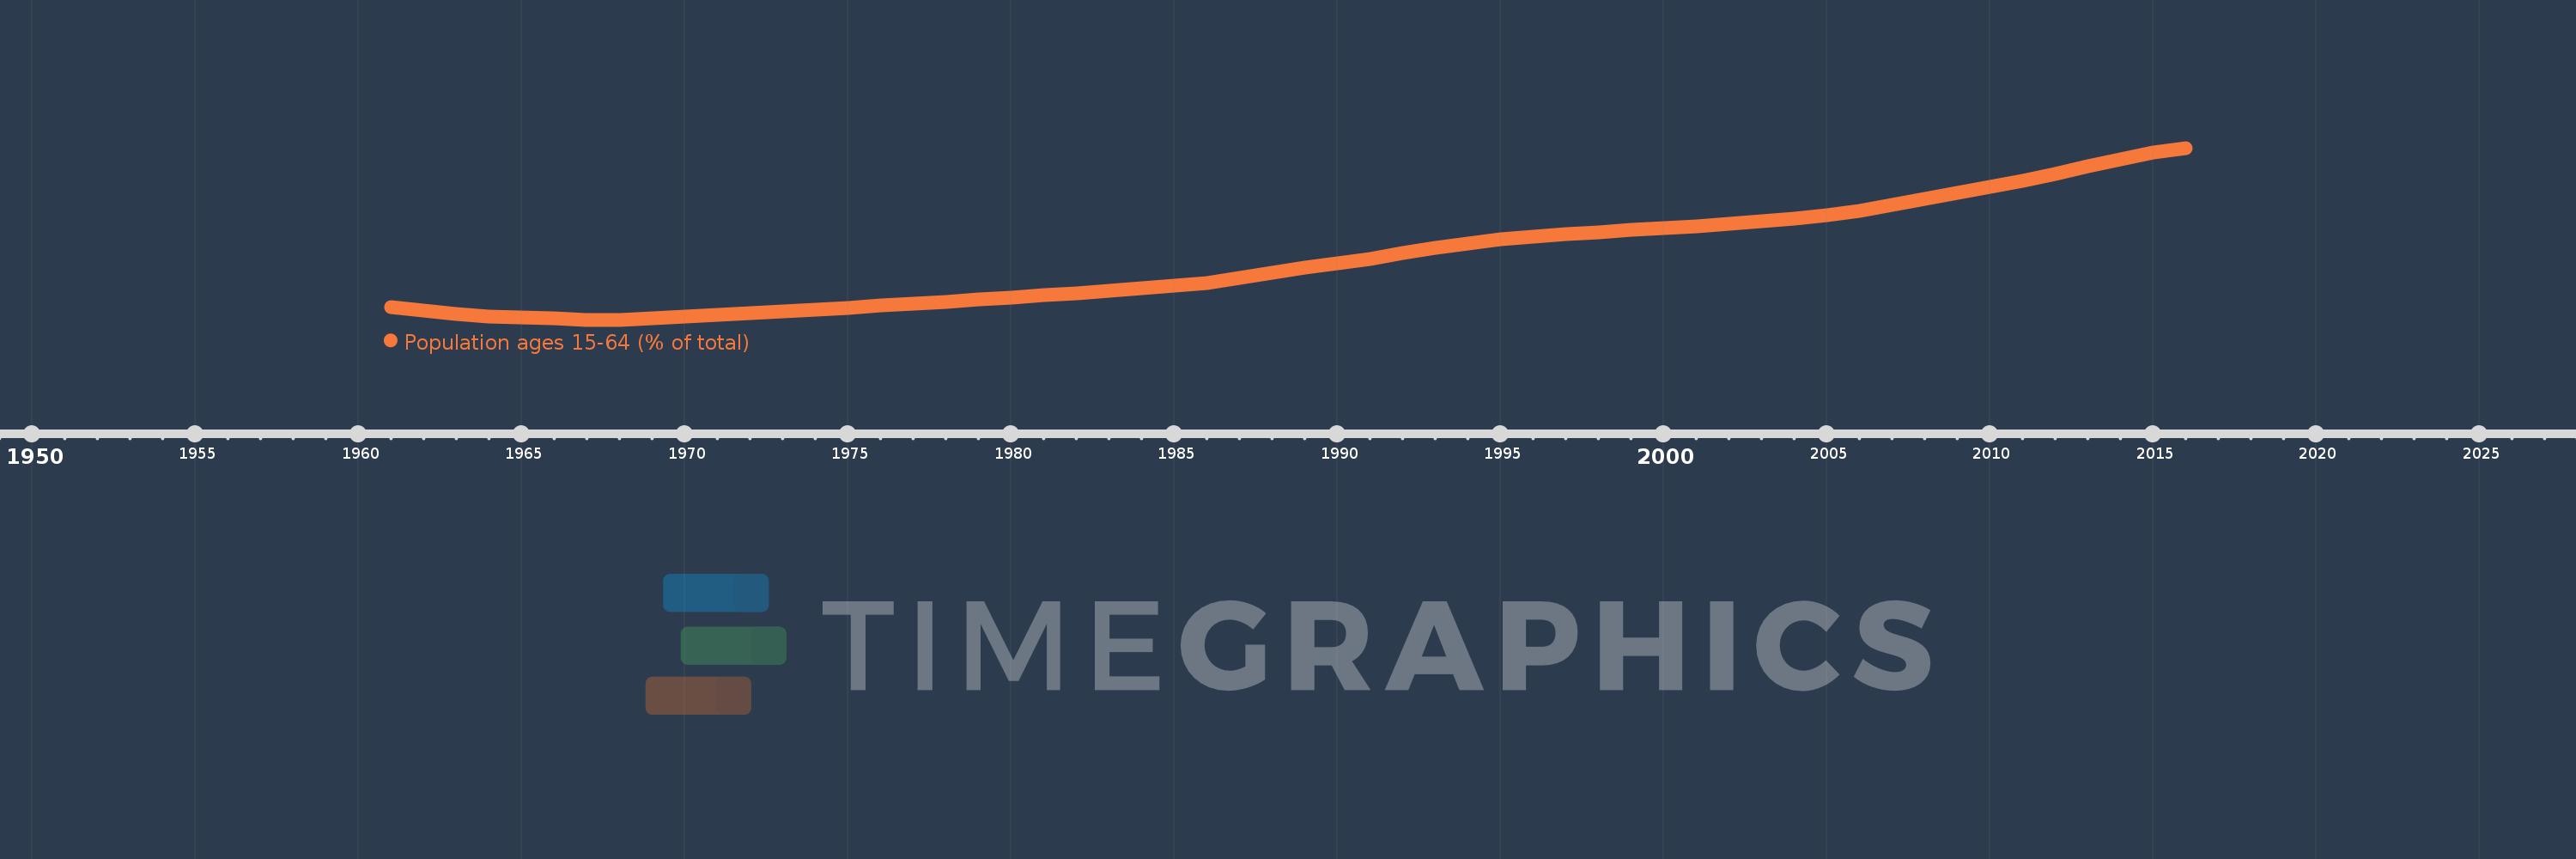
Population ages 15-64 (% of total)
2016,2015,2014,2013,2012,2011,2010,2009,2008,2007,2006,2005,2004,2003,2002,2001,2000,1999,1998,1997,1996,1995,1994,1993,1992,1991,1990,1989,1988,1987,1986,1985,1984,1983,1982,1981,1980,1979,1978,1977,1976,1975,1974,1973,1972,1971,1970,1969,1968,1967,1966,1965,1964,1963,1962,1961
Estas estadísticas en otros países:
AfghanistanAlbaniaAlgeriaAngolaAntigua and BarbudaArab WorldArgentinaArmeniaArubaAustraliaAustriaAzerbaijanBahamas, TheBahrainBangladeshBarbadosBelarusBelgiumBelizeBeninBhutanBoliviaBosnia and HerzegovinaBotswanaBrazilBrunei DarussalamBulgariaBurkina FasoBurundiCabo VerdeCambodiaCameroonCanadaCaribbean small statesCentral African RepublicCentral Europe and the BalticsChadChannel IslandsChileChinaColombiaComorosCongo, Dem. Rep.Congo, Rep.Costa RicaCote d'IvoireCroatiaCubaCuracaoCyprusCzech RepublicDenmarkDjiboutiDominican RepublicEarly-demographic dividendEast Asia & PacificEast Asia & Pacific (excluding high income)East Asia & Pacific (IDA & IBRD countries)EcuadorEgypt, Arab Rep.El SalvadorEquatorial GuineaEritreaEstoniaEthiopiaEuro areaEurope & Central AsiaEurope & Central Asia (excluding high income)Europe & Central Asia (IDA & IBRD countries)European UnionFijiFinlandFragile and conflict affected situationsFranceFrench PolynesiaGabonGambia, TheGeorgiaGermanyGhanaGreeceGrenadaGuamGuatemalaGuineaGuinea-BissauGuyanaHaitiHeavily indebted poor countries (HIPC)High incomeHondurasHong Kong SAR, ChinaHungaryIBRD onlyIcelandIDA & IBRD totalIDA blendIDA onlyIDA totalIndiaIndonesiaIran, Islamic Rep.IraqIrelandIsraelItalyJamaicaJapanJordanKazakhstanKenyaKiribatiKorea, Dem. People’s Rep.Korea, Rep.KosovoKuwaitKyrgyz RepublicLao PDRLate-demographic dividendLatin America & Caribbean Latin America & Caribbean (excluding high income)Latin America & the Caribbean (IDA & IBRD countries)LatviaLeast developed countries: UN classificationLebanonLesothoLiberiaLibyaLithuaniaLow & middle incomeLow incomeLower middle incomeLuxembourgMacao SAR, ChinaMacedonia, FYRMadagascarMalawiMalaysiaMaldivesMaliMaltaMauritaniaMauritiusMexicoMicronesia, Fed. Sts.Middle East & North AfricaMiddle East & North Africa (excluding high income)Middle East & North Africa (IDA & IBRD countries)Middle incomeMoldovaMongoliaMontenegroMoroccoMozambiqueMyanmarNamibiaNepalNetherlandsNew CaledoniaNew ZealandNicaraguaNigerNigeriaNorth AmericaNorwayOECD membersOmanOther small statesPacific island small statesPakistanPanamaPapua New GuineaParaguayPeruPhilippinesPolandPortugalPost-demographic dividendPre-demographic dividendPuerto RicoQatarRomaniaRussian FederationRwandaSamoaSao Tome and PrincipeSaudi ArabiaSenegalSerbiaSeychellesSierra LeoneSingaporeSlovak RepublicSloveniaSmall statesSolomon IslandsSomaliaSouth AfricaSouth AsiaSouth Asia (IDA & IBRD)South SudanSpainSri LankaSt. LuciaSt. Vincent and the GrenadinesSub-Saharan Africa Sub-Saharan Africa (excluding high income)Sub-Saharan Africa (IDA & IBRD countries)SudanSurinameSwazilandSwedenSwitzerlandSyrian Arab RepublicTajikistanTanzaniaThailandTimor-LesteTogoTongaTrinidad and TobagoTunisiaTurkeyTurkmenistanUgandaUkraineUnited Arab EmiratesUnited KingdomUnited StatesUpper middle incomeUruguayUzbekistanVanuatuVenezuela, RBVietnamVirgin Islands (U.S.)West Bank and GazaWorldYemen, Rep.ZambiaZimbabwe línea de tiempo (timeline):
En esta escala de tiempo se presenta un gráfico de 1961 y 2016 de El Salvador. Los datos de 1960 están ausentes. El número de observaciones reales por fecha: 56.
Fuente (nombre):
Indicadores del desarrollo mundial
Fuente (organización):
World Bank staff estimates based on age distributions of United Nations Population Division's World Population Prospects.
Categorías:
Education, Health
Se ha actualizado:
23 abr 2017 año
Los indicadores de los cambios de valor en los últimos años
Mínimo:
50.765
1 ene 1968 año
Máximo:
64.8
1 ene 2016 año
A la fecha de observación
Valor
Cambio absoluto
El cambio con respecto al valor anterior
1 ene 1961 año
51.778
+51.778
0.0%
1 ene 1962 año
51.517
-0.262
-0.51%
1 ene 1963 año
51.266
-0.251
-0.49%
1 ene 1964 año
51.054
-0.212
-0.41%
1 ene 1965 año
50.929
-0.125
-0.24%
1 ene 1966 año
50.914
-0.015
-0.03%
1 ene 1967 año
50.772
-0.142
-0.28%
1 ene 1968 año
50.765
-0.007
-0.01%
1 ene 1969 año
50.854
+0.089
0.18%
1 ene 1970 año
50.991
+0.136
0.27%
1 ene 1971 año
51.152
+0.162
0.32%
1 ene 1972 año
51.284
+0.131
0.26%
1 ene 1973 año
51.421
+0.137
0.27%
1 ene 1974 año
51.569
+0.148
0.29%
1 ene 1975 año
51.743
+0.175
0.34%
1 ene 1976 año
51.955
+0.211
0.41%
1 ene 1977 año
52.094
+0.139
0.27%
1 ene 1978 año
52.25
+0.156
0.3%
1 ene 1979 año
52.413
+0.163
0.31%
1 ene 1980 año
52.579
+0.166
0.32%
1 ene 1981 año
52.757
+0.178
0.34%
1 ene 1982 año
52.949
+0.192
0.36%
1 ene 1983 año
53.155
+0.206
0.39%
1 ene 1984 año
53.366
+0.211
0.4%
1 ene 1985 año
53.575
+0.209
0.39%
1 ene 1986 año
53.786
+0.211
0.39%
1 ene 1987 año
54.217
+0.431
0.8%
1 ene 1988 año
54.62
+0.403
0.74%
1 ene 1989 año
55.003
+0.383
0.7%
1 ene 1990 año
55.378
+0.374
0.68%
1 ene 1991 año
55.741
+0.364
0.66%
1 ene 1992 año
56.192
+0.451
0.81%
1 ene 1993 año
56.614
+0.421
0.75%
1 ene 1994 año
56.99
+0.376
0.66%
1 ene 1995 año
57.309
+0.319
0.56%
1 ene 1996 año
57.575
+0.266
0.46%
1 ene 1997 año
57.765
+0.19
0.33%
1 ene 1998 año
57.936
+0.171
0.3%
1 ene 1999 año
58.09
+0.153
0.26%
1 ene 2000 año
58.235
+0.145
0.25%
1 ene 2001 año
58.388
+0.153
0.26%
1 ene 2002 año
58.587
+0.199
0.34%
1 ene 2003 año
58.805
+0.217
0.37%
1 ene 2004 año
59.051
+0.246
0.42%
1 ene 2005 año
59.334
+0.283
0.48%
1 ene 2006 año
59.659
+0.325
0.55%
1 ene 2007 año
60.148
+0.489
0.82%
1 ene 2008 año
60.626
+0.479
0.8%
1 ene 2009 año
61.11
+0.484
0.8%
1 ene 2010 año
61.613
+0.503
0.82%
1 ene 2011 año
62.138
+0.525
0.85%
1 ene 2012 año
62.707
+0.569
0.92%
1 ene 2013 año
63.303
+0.596
0.95%
1 ene 2014 año
63.885
+0.582
0.92%
1 ene 2015 año
64.394
+0.509
0.8%
1 ene 2016 año
64.8
+0.406
0.63%
Ranking de los países por los datos estadísticos actuales


Comentarios: