29
/es/
es
AIzaSyAYiBZKx7MnpbEhh9jyipgxe19OcubqV5w
April 1, 2024
106439
China
CHN
true
2
1
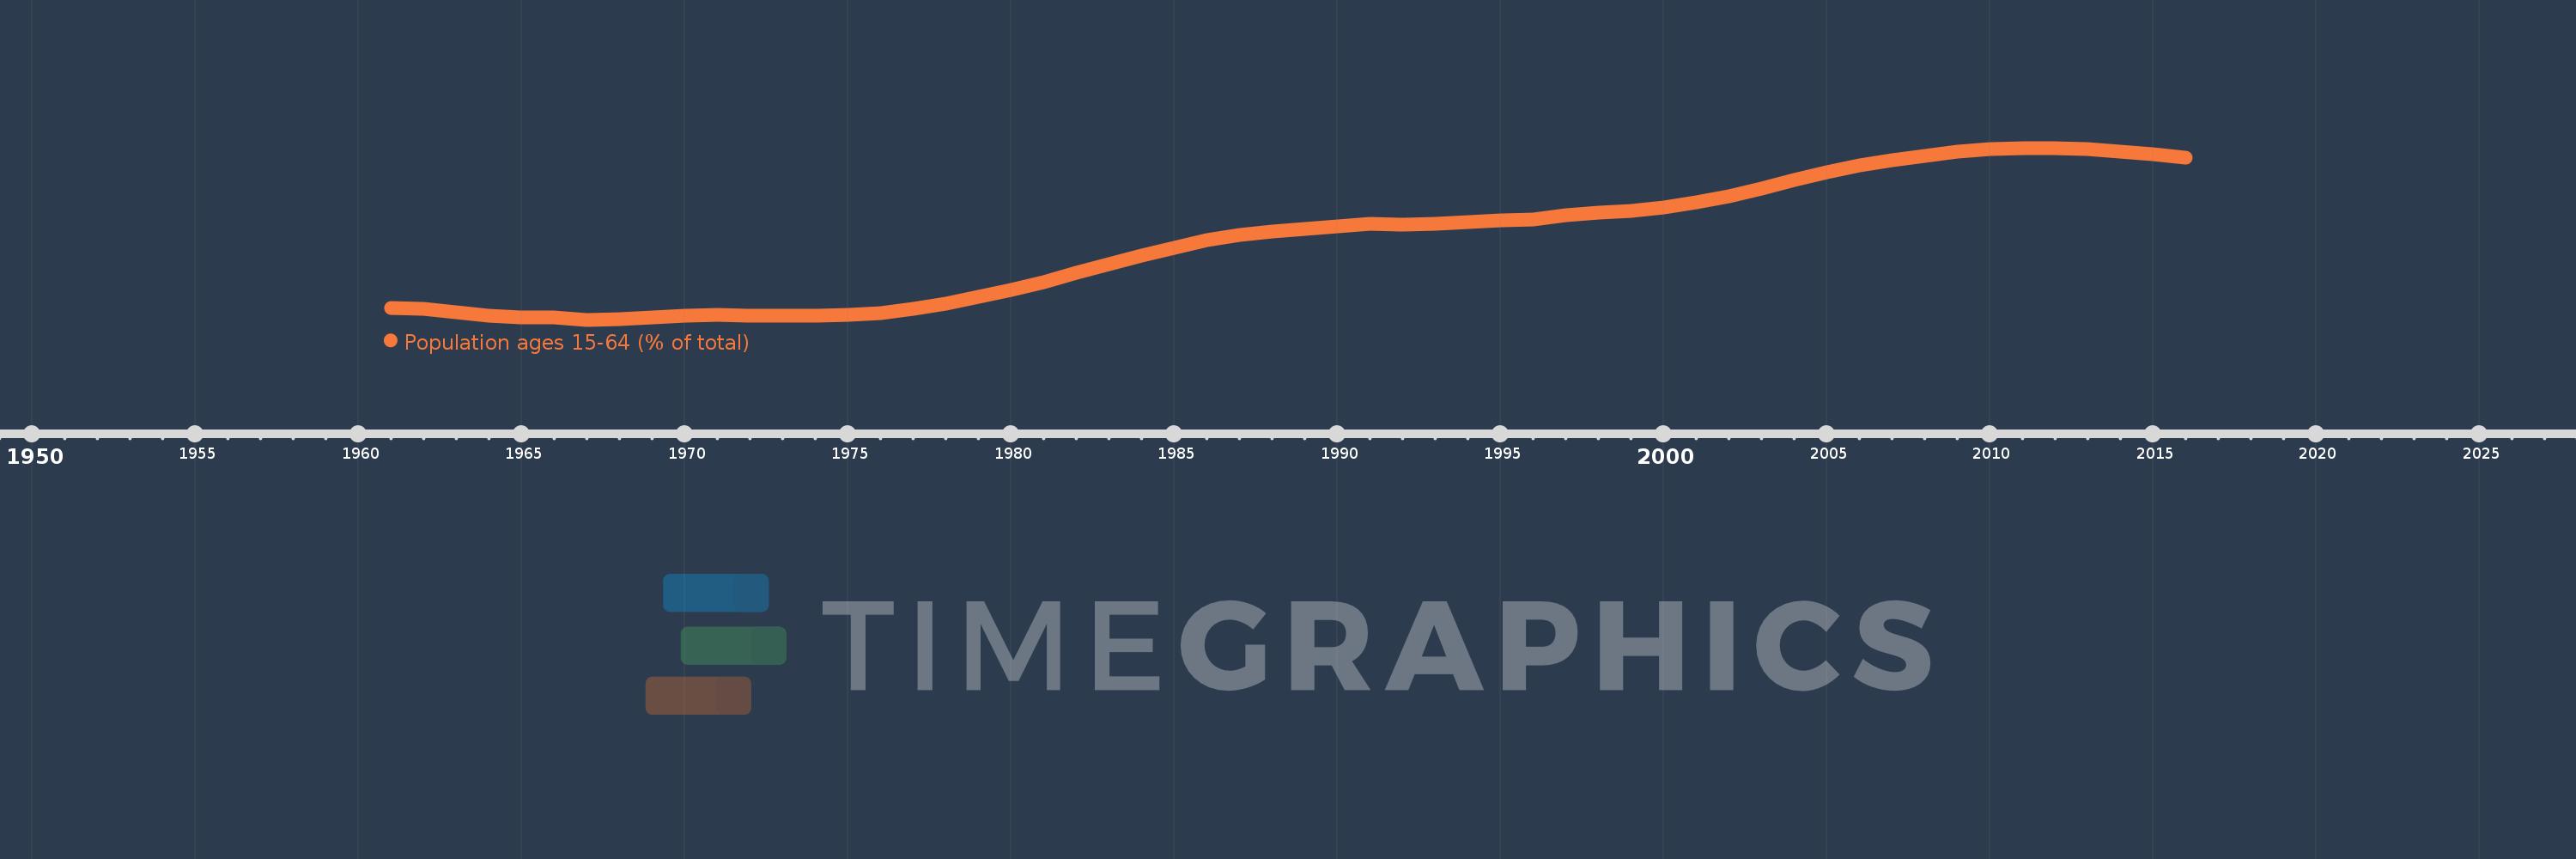
Population ages 15-64 (% of total)
2016,2015,2014,2013,2012,2011,2010,2009,2008,2007,2006,2005,2004,2003,2002,2001,2000,1999,1998,1997,1996,1995,1994,1993,1992,1991,1990,1989,1988,1987,1986,1985,1984,1983,1982,1981,1980,1979,1978,1977,1976,1975,1974,1973,1972,1971,1970,1969,1968,1967,1966,1965,1964,1963,1962,1961
Estas estadísticas en otros países:
AfghanistanAlbaniaAlgeriaAngolaAntigua and BarbudaArab WorldArgentinaArmeniaArubaAustraliaAustriaAzerbaijanBahamas, TheBahrainBangladeshBarbadosBelarusBelgiumBelizeBeninBhutanBoliviaBosnia and HerzegovinaBotswanaBrazilBrunei DarussalamBulgariaBurkina FasoBurundiCabo VerdeCambodiaCameroonCanadaCaribbean small statesCentral African RepublicCentral Europe and the BalticsChadChannel IslandsChileChinaColombiaComorosCongo, Dem. Rep.Congo, Rep.Costa RicaCote d'IvoireCroatiaCubaCuracaoCyprusCzech RepublicDenmarkDjiboutiDominican RepublicEarly-demographic dividendEast Asia & PacificEast Asia & Pacific (excluding high income)East Asia & Pacific (IDA & IBRD countries)EcuadorEgypt, Arab Rep.El SalvadorEquatorial GuineaEritreaEstoniaEthiopiaEuro areaEurope & Central AsiaEurope & Central Asia (excluding high income)Europe & Central Asia (IDA & IBRD countries)European UnionFijiFinlandFragile and conflict affected situationsFranceFrench PolynesiaGabonGambia, TheGeorgiaGermanyGhanaGreeceGrenadaGuamGuatemalaGuineaGuinea-BissauGuyanaHaitiHeavily indebted poor countries (HIPC)High incomeHondurasHong Kong SAR, ChinaHungaryIBRD onlyIcelandIDA & IBRD totalIDA blendIDA onlyIDA totalIndiaIndonesiaIran, Islamic Rep.IraqIrelandIsraelItalyJamaicaJapanJordanKazakhstanKenyaKiribatiKorea, Dem. People’s Rep.Korea, Rep.KosovoKuwaitKyrgyz RepublicLao PDRLate-demographic dividendLatin America & Caribbean Latin America & Caribbean (excluding high income)Latin America & the Caribbean (IDA & IBRD countries)LatviaLeast developed countries: UN classificationLebanonLesothoLiberiaLibyaLithuaniaLow & middle incomeLow incomeLower middle incomeLuxembourgMacao SAR, ChinaMacedonia, FYRMadagascarMalawiMalaysiaMaldivesMaliMaltaMauritaniaMauritiusMexicoMicronesia, Fed. Sts.Middle East & North AfricaMiddle East & North Africa (excluding high income)Middle East & North Africa (IDA & IBRD countries)Middle incomeMoldovaMongoliaMontenegroMoroccoMozambiqueMyanmarNamibiaNepalNetherlandsNew CaledoniaNew ZealandNicaraguaNigerNigeriaNorth AmericaNorwayOECD membersOmanOther small statesPacific island small statesPakistanPanamaPapua New GuineaParaguayPeruPhilippinesPolandPortugalPost-demographic dividendPre-demographic dividendPuerto RicoQatarRomaniaRussian FederationRwandaSamoaSao Tome and PrincipeSaudi ArabiaSenegalSerbiaSeychellesSierra LeoneSingaporeSlovak RepublicSloveniaSmall statesSolomon IslandsSomaliaSouth AfricaSouth AsiaSouth Asia (IDA & IBRD)South SudanSpainSri LankaSt. LuciaSt. Vincent and the GrenadinesSub-Saharan Africa Sub-Saharan Africa (excluding high income)Sub-Saharan Africa (IDA & IBRD countries)SudanSurinameSwazilandSwedenSwitzerlandSyrian Arab RepublicTajikistanTanzaniaThailandTimor-LesteTogoTongaTrinidad and TobagoTunisiaTurkeyTurkmenistanUgandaUkraineUnited Arab EmiratesUnited KingdomUnited StatesUpper middle incomeUruguayUzbekistanVanuatuVenezuela, RBVietnamVirgin Islands (U.S.)West Bank and GazaWorldYemen, Rep.ZambiaZimbabwe línea de tiempo (timeline):
En esta escala de tiempo se presenta un gráfico de 1961 y 2016 de China. Los datos de 1960 están ausentes. El número de observaciones reales por fecha: 56.
Fuente (nombre):
Indicadores del desarrollo mundial
Fuente (organización):
World Bank staff estimates based on age distributions of United Nations Population Division's World Population Prospects.
Categorías:
Education, Health
Se ha actualizado:
23 abr 2017 año
Los indicadores de los cambios de valor en los últimos años
Mínimo:
55.077
1 ene 1967 año
Máximo:
74.353
1 ene 2012 año
A la fecha de observación
Valor
Cambio absoluto
El cambio con respecto al valor anterior
1 ene 1961 año
56.395
+56.395
0.0%
1 ene 1962 año
56.317
-0.078
-0.14%
1 ene 1963 año
55.962
-0.355
-0.63%
1 ene 1964 año
55.535
-0.427
-0.76%
1 ene 1965 año
55.303
-0.233
-0.42%
1 ene 1966 año
55.346
+0.044
0.08%
1 ene 1967 año
55.077
-0.27
-0.49%
1 ene 1968 año
55.13
+0.053
0.1%
1 ene 1969 año
55.358
+0.228
0.41%
1 ene 1970 año
55.562
+0.204
0.37%
1 ene 1971 año
55.664
+0.103
0.18%
1 ene 1972 año
55.556
-0.108
-0.19%
1 ene 1973 año
55.498
-0.059
-0.11%
1 ene 1974 año
55.491
-0.006
-0.01%
1 ene 1975 año
55.597
+0.106
0.19%
1 ene 1976 año
55.865
+0.267
0.48%
1 ene 1977 año
56.326
+0.462
0.83%
1 ene 1978 año
56.906
+0.579
1.03%
1 ene 1979 año
57.609
+0.704
1.24%
1 ene 1980 año
58.421
+0.812
1.41%
1 ene 1981 año
59.311
+0.889
1.52%
1 ene 1982 año
60.338
+1.027
1.73%
1 ene 1983 año
61.326
+0.988
1.64%
1 ene 1984 año
62.283
+0.957
1.56%
1 ene 1985 año
63.192
+0.909
1.46%
1 ene 1986 año
64.01
+0.818
1.29%
1 ene 1987 año
64.542
+0.532
0.83%
1 ene 1988 año
64.976
+0.434
0.67%
1 ene 1989 año
65.308
+0.332
0.51%
1 ene 1990 año
65.574
+0.266
0.41%
1 ene 1991 año
65.816
+0.242
0.37%
1 ene 1992 año
65.722
-0.094
-0.14%
1 ene 1993 año
65.837
+0.115
0.17%
1 ene 1994 año
66.048
+0.211
0.32%
1 ene 1995 año
66.228
+0.18
0.27%
1 ene 1996 año
66.343
+0.115
0.17%
1 ene 1997 año
66.788
+0.445
0.67%
1 ene 1998 año
67.049
+0.261
0.39%
1 ene 1999 año
67.275
+0.226
0.34%
1 ene 2000 año
67.663
+0.389
0.58%
1 ene 2001 año
68.284
+0.621
0.92%
1 ene 2002 año
68.966
+0.682
1.0%
1 ene 2003 año
69.797
+0.831
1.21%
1 ene 2004 año
70.723
+0.925
1.33%
1 ene 2005 año
71.623
+0.9
1.27%
1 ene 2006 año
72.419
+0.796
1.11%
1 ene 2007 año
72.966
+0.548
0.76%
1 ene 2008 año
73.486
+0.52
0.71%
1 ene 2009 año
73.918
+0.431
0.59%
1 ene 2010 año
74.208
+0.29
0.39%
1 ene 2011 año
74.339
+0.131
0.18%
1 ene 2012 año
74.353
+0.014
0.02%
1 ene 2013 año
74.219
-0.135
-0.18%
1 ene 2014 año
73.956
-0.262
-0.35%
1 ene 2015 año
73.612
-0.344
-0.47%
1 ene 2016 año
73.217
-0.395
-0.54%
Ranking de los países por los datos estadísticos actuales


Comentarios: