29
/es/
es
AIzaSyAYiBZKx7MnpbEhh9jyipgxe19OcubqV5w
April 1, 2024
164139
Japan
JPN
true
2
1
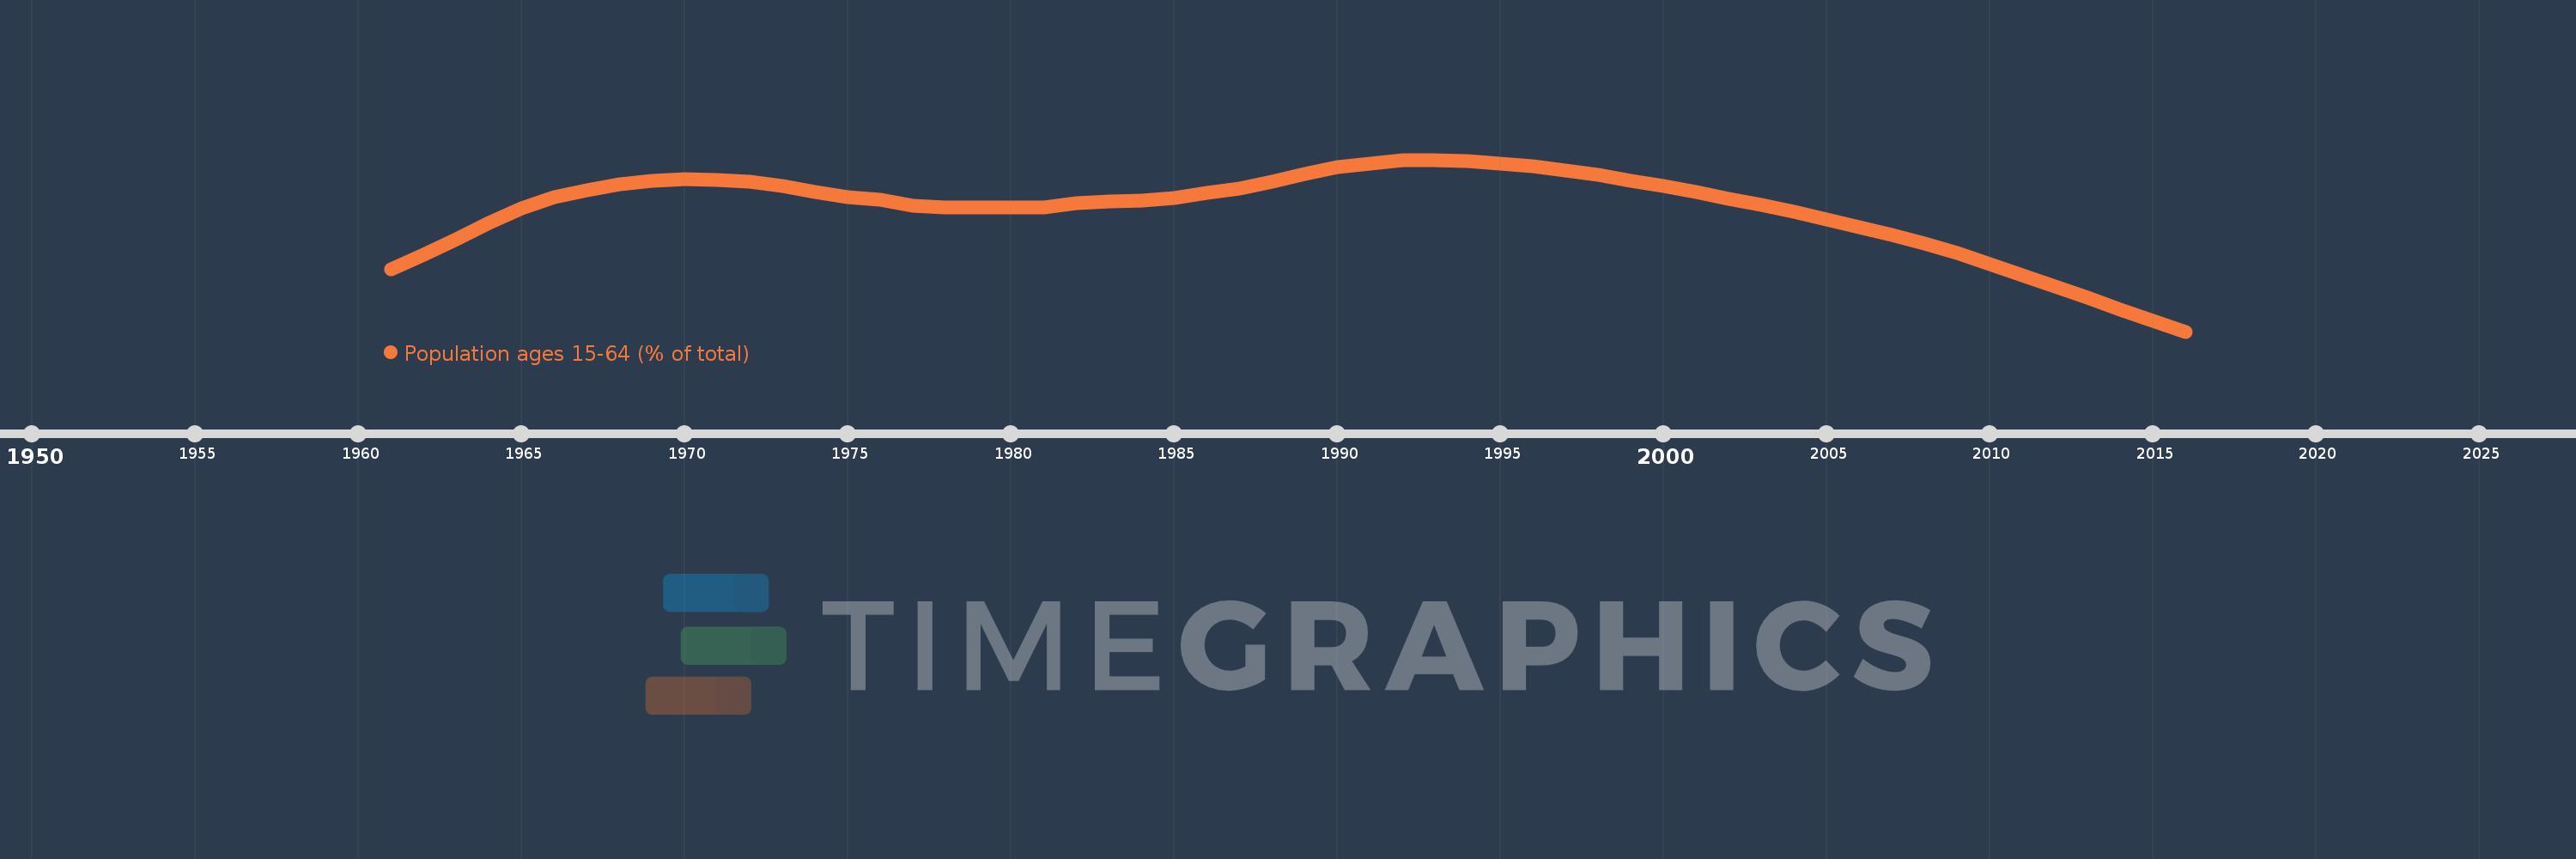
Population ages 15-64 (% of total)
2016,2015,2014,2013,2012,2011,2010,2009,2008,2007,2006,2005,2004,2003,2002,2001,2000,1999,1998,1997,1996,1995,1994,1993,1992,1991,1990,1989,1988,1987,1986,1985,1984,1983,1982,1981,1980,1979,1978,1977,1976,1975,1974,1973,1972,1971,1970,1969,1968,1967,1966,1965,1964,1963,1962,1961
Estas estadísticas en otros países:
AfghanistanAlbaniaAlgeriaAngolaAntigua and BarbudaArab WorldArgentinaArmeniaArubaAustraliaAustriaAzerbaijanBahamas, TheBahrainBangladeshBarbadosBelarusBelgiumBelizeBeninBhutanBoliviaBosnia and HerzegovinaBotswanaBrazilBrunei DarussalamBulgariaBurkina FasoBurundiCabo VerdeCambodiaCameroonCanadaCaribbean small statesCentral African RepublicCentral Europe and the BalticsChadChannel IslandsChileChinaColombiaComorosCongo, Dem. Rep.Congo, Rep.Costa RicaCote d'IvoireCroatiaCubaCuracaoCyprusCzech RepublicDenmarkDjiboutiDominican RepublicEarly-demographic dividendEast Asia & PacificEast Asia & Pacific (excluding high income)East Asia & Pacific (IDA & IBRD countries)EcuadorEgypt, Arab Rep.El SalvadorEquatorial GuineaEritreaEstoniaEthiopiaEuro areaEurope & Central AsiaEurope & Central Asia (excluding high income)Europe & Central Asia (IDA & IBRD countries)European UnionFijiFinlandFragile and conflict affected situationsFranceFrench PolynesiaGabonGambia, TheGeorgiaGermanyGhanaGreeceGrenadaGuamGuatemalaGuineaGuinea-BissauGuyanaHaitiHeavily indebted poor countries (HIPC)High incomeHondurasHong Kong SAR, ChinaHungaryIBRD onlyIcelandIDA & IBRD totalIDA blendIDA onlyIDA totalIndiaIndonesiaIran, Islamic Rep.IraqIrelandIsraelItalyJamaicaJapanJordanKazakhstanKenyaKiribatiKorea, Dem. People’s Rep.Korea, Rep.KosovoKuwaitKyrgyz RepublicLao PDRLate-demographic dividendLatin America & Caribbean Latin America & Caribbean (excluding high income)Latin America & the Caribbean (IDA & IBRD countries)LatviaLeast developed countries: UN classificationLebanonLesothoLiberiaLibyaLithuaniaLow & middle incomeLow incomeLower middle incomeLuxembourgMacao SAR, ChinaMacedonia, FYRMadagascarMalawiMalaysiaMaldivesMaliMaltaMauritaniaMauritiusMexicoMicronesia, Fed. Sts.Middle East & North AfricaMiddle East & North Africa (excluding high income)Middle East & North Africa (IDA & IBRD countries)Middle incomeMoldovaMongoliaMontenegroMoroccoMozambiqueMyanmarNamibiaNepalNetherlandsNew CaledoniaNew ZealandNicaraguaNigerNigeriaNorth AmericaNorwayOECD membersOmanOther small statesPacific island small statesPakistanPanamaPapua New GuineaParaguayPeruPhilippinesPolandPortugalPost-demographic dividendPre-demographic dividendPuerto RicoQatarRomaniaRussian FederationRwandaSamoaSao Tome and PrincipeSaudi ArabiaSenegalSerbiaSeychellesSierra LeoneSingaporeSlovak RepublicSloveniaSmall statesSolomon IslandsSomaliaSouth AfricaSouth AsiaSouth Asia (IDA & IBRD)South SudanSpainSri LankaSt. LuciaSt. Vincent and the GrenadinesSub-Saharan Africa Sub-Saharan Africa (excluding high income)Sub-Saharan Africa (IDA & IBRD countries)SudanSurinameSwazilandSwedenSwitzerlandSyrian Arab RepublicTajikistanTanzaniaThailandTimor-LesteTogoTongaTrinidad and TobagoTunisiaTurkeyTurkmenistanUgandaUkraineUnited Arab EmiratesUnited KingdomUnited StatesUpper middle incomeUruguayUzbekistanVanuatuVenezuela, RBVietnamVirgin Islands (U.S.)West Bank and GazaWorldYemen, Rep.ZambiaZimbabwe línea de tiempo (timeline):
En esta escala de tiempo se presenta un gráfico de 1961 y 2016 de Japan. Los datos de 1960 están ausentes. El número de observaciones reales por fecha: 56.
Fuente (nombre):
Indicadores del desarrollo mundial
Fuente (organización):
World Bank staff estimates based on age distributions of United Nations Population Division's World Population Prospects.
Categorías:
Education, Health
Se ha actualizado:
23 abr 2017 año
Los indicadores de los cambios de valor en los últimos años
Mínimo:
60.802
1 ene 2016 año
Máximo:
69.922
1 ene 1993 año
A la fecha de observación
Valor
Cambio absoluto
El cambio con respecto al valor anterior
1 ene 1961 año
64.115
+64.115
0.0%
1 ene 1962 año
64.867
+0.752
1.17%
1 ene 1963 año
65.697
+0.83
1.28%
1 ene 1964 año
66.55
+0.853
1.3%
1 ene 1965 año
67.323
+0.773
1.16%
1 ene 1966 año
67.955
+0.633
0.94%
1 ene 1967 año
68.307
+0.352
0.52%
1 ene 1968 año
68.605
+0.297
0.44%
1 ene 1969 año
68.809
+0.205
0.3%
1 ene 1970 año
68.891
+0.081
0.12%
1 ene 1971 año
68.846
-0.045
-0.06%
1 ene 1972 año
68.764
-0.082
-0.12%
1 ene 1973 año
68.533
-0.231
-0.34%
1 ene 1974 año
68.226
-0.307
-0.45%
1 ene 1975 año
67.957
-0.27
-0.4%
1 ene 1976 año
67.783
-0.173
-0.26%
1 ene 1977 año
67.48
-0.303
-0.45%
1 ene 1978 año
67.369
-0.111
-0.17%
1 ene 1979 año
67.379
+0.01
0.01%
1 ene 1980 año
67.402
+0.023
0.03%
1 ene 1981 año
67.393
-0.009
-0.01%
1 ene 1982 año
67.604
+0.211
0.31%
1 ene 1983 año
67.696
+0.092
0.14%
1 ene 1984 año
67.756
+0.06
0.09%
1 ene 1985 año
67.903
+0.147
0.22%
1 ene 1986 año
68.178
+0.275
0.4%
1 ene 1987 año
68.404
+0.226
0.33%
1 ene 1988 año
68.762
+0.359
0.52%
1 ene 1989 año
69.181
+0.419
0.61%
1 ene 1990 año
69.53
+0.349
0.5%
1 ene 1991 año
69.737
+0.207
0.3%
1 ene 1992 año
69.895
+0.157
0.23%
1 ene 1993 año
69.922
+0.027
0.04%
1 ene 1994 año
69.844
-0.078
-0.11%
1 ene 1995 año
69.715
-0.129
-0.18%
1 ene 1996 año
69.564
-0.151
-0.22%
1 ene 1997 año
69.354
-0.21
-0.3%
1 ene 1998 año
69.103
-0.251
-0.36%
1 ene 1999 año
68.823
-0.28
-0.41%
1 ene 2000 año
68.52
-0.303
-0.44%
1 ene 2001 año
68.195
-0.324
-0.47%
1 ene 2002 año
67.859
-0.336
-0.49%
1 ene 2003 año
67.518
-0.341
-0.5%
1 ene 2004 año
67.159
-0.359
-0.53%
1 ene 2005 año
66.771
-0.388
-0.58%
1 ene 2006 año
66.35
-0.421
-0.63%
1 ene 2007 año
65.926
-0.424
-0.64%
1 ene 2008 año
65.463
-0.464
-0.7%
1 ene 2009 año
64.952
-0.511
-0.78%
1 ene 2010 año
64.387
-0.565
-0.87%
1 ene 2011 año
63.768
-0.619
-0.96%
1 ene 2012 año
63.193
-0.575
-0.9%
1 ene 2013 año
62.582
-0.611
-0.97%
1 ene 2014 año
61.958
-0.625
-1.0%
1 ene 2015 año
61.355
-0.602
-0.97%
1 ene 2016 año
60.802
-0.553
-0.9%
Ranking de los países por los datos estadísticos actuales


Comentarios: