29
/es/
es
AIzaSyAYiBZKx7MnpbEhh9jyipgxe19OcubqV5w
April 1, 2024
176886
Lebanon
LBN
true
2
1
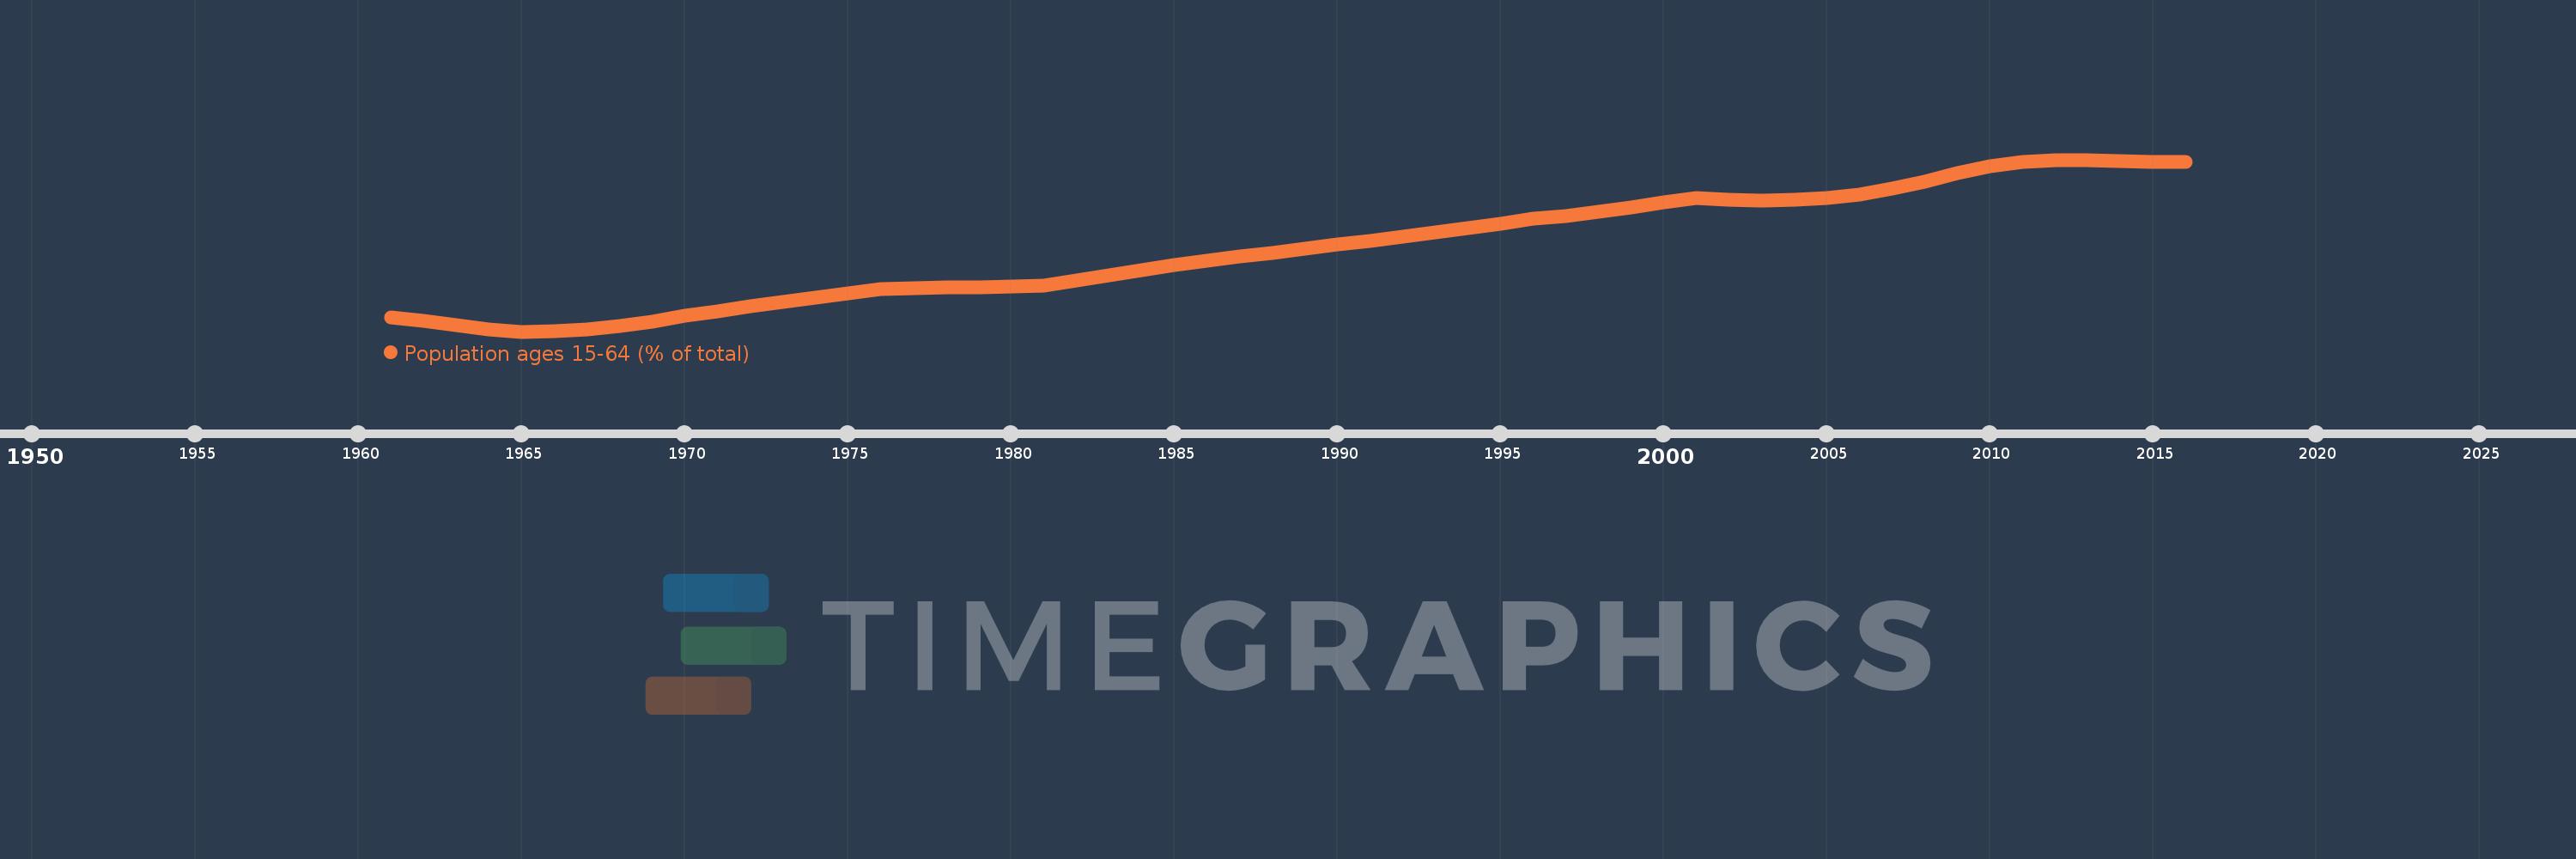
Population ages 15-64 (% of total)
2016,2015,2014,2013,2012,2011,2010,2009,2008,2007,2006,2005,2004,2003,2002,2001,2000,1999,1998,1997,1996,1995,1994,1993,1992,1991,1990,1989,1988,1987,1986,1985,1984,1983,1982,1981,1980,1979,1978,1977,1976,1975,1974,1973,1972,1971,1970,1969,1968,1967,1966,1965,1964,1963,1962,1961
Estas estadísticas en otros países:
AfghanistanAlbaniaAlgeriaAngolaAntigua and BarbudaArab WorldArgentinaArmeniaArubaAustraliaAustriaAzerbaijanBahamas, TheBahrainBangladeshBarbadosBelarusBelgiumBelizeBeninBhutanBoliviaBosnia and HerzegovinaBotswanaBrazilBrunei DarussalamBulgariaBurkina FasoBurundiCabo VerdeCambodiaCameroonCanadaCaribbean small statesCentral African RepublicCentral Europe and the BalticsChadChannel IslandsChileChinaColombiaComorosCongo, Dem. Rep.Congo, Rep.Costa RicaCote d'IvoireCroatiaCubaCuracaoCyprusCzech RepublicDenmarkDjiboutiDominican RepublicEarly-demographic dividendEast Asia & PacificEast Asia & Pacific (excluding high income)East Asia & Pacific (IDA & IBRD countries)EcuadorEgypt, Arab Rep.El SalvadorEquatorial GuineaEritreaEstoniaEthiopiaEuro areaEurope & Central AsiaEurope & Central Asia (excluding high income)Europe & Central Asia (IDA & IBRD countries)European UnionFijiFinlandFragile and conflict affected situationsFranceFrench PolynesiaGabonGambia, TheGeorgiaGermanyGhanaGreeceGrenadaGuamGuatemalaGuineaGuinea-BissauGuyanaHaitiHeavily indebted poor countries (HIPC)High incomeHondurasHong Kong SAR, ChinaHungaryIBRD onlyIcelandIDA & IBRD totalIDA blendIDA onlyIDA totalIndiaIndonesiaIran, Islamic Rep.IraqIrelandIsraelItalyJamaicaJapanJordanKazakhstanKenyaKiribatiKorea, Dem. People’s Rep.Korea, Rep.KosovoKuwaitKyrgyz RepublicLao PDRLate-demographic dividendLatin America & Caribbean Latin America & Caribbean (excluding high income)Latin America & the Caribbean (IDA & IBRD countries)LatviaLeast developed countries: UN classificationLebanonLesothoLiberiaLibyaLithuaniaLow & middle incomeLow incomeLower middle incomeLuxembourgMacao SAR, ChinaMacedonia, FYRMadagascarMalawiMalaysiaMaldivesMaliMaltaMauritaniaMauritiusMexicoMicronesia, Fed. Sts.Middle East & North AfricaMiddle East & North Africa (excluding high income)Middle East & North Africa (IDA & IBRD countries)Middle incomeMoldovaMongoliaMontenegroMoroccoMozambiqueMyanmarNamibiaNepalNetherlandsNew CaledoniaNew ZealandNicaraguaNigerNigeriaNorth AmericaNorwayOECD membersOmanOther small statesPacific island small statesPakistanPanamaPapua New GuineaParaguayPeruPhilippinesPolandPortugalPost-demographic dividendPre-demographic dividendPuerto RicoQatarRomaniaRussian FederationRwandaSamoaSao Tome and PrincipeSaudi ArabiaSenegalSerbiaSeychellesSierra LeoneSingaporeSlovak RepublicSloveniaSmall statesSolomon IslandsSomaliaSouth AfricaSouth AsiaSouth Asia (IDA & IBRD)South SudanSpainSri LankaSt. LuciaSt. Vincent and the GrenadinesSub-Saharan Africa Sub-Saharan Africa (excluding high income)Sub-Saharan Africa (IDA & IBRD countries)SudanSurinameSwazilandSwedenSwitzerlandSyrian Arab RepublicTajikistanTanzaniaThailandTimor-LesteTogoTongaTrinidad and TobagoTunisiaTurkeyTurkmenistanUgandaUkraineUnited Arab EmiratesUnited KingdomUnited StatesUpper middle incomeUruguayUzbekistanVanuatuVenezuela, RBVietnamVirgin Islands (U.S.)West Bank and GazaWorldYemen, Rep.ZambiaZimbabwe línea de tiempo (timeline):
En esta escala de tiempo se presenta un gráfico de 1961 y 2016 de Lebanon. Los datos de 1960 están ausentes. El número de observaciones reales por fecha: 56.
Fuente (nombre):
Indicadores del desarrollo mundial
Fuente (organización):
World Bank staff estimates based on age distributions of United Nations Population Division's World Population Prospects.
Categorías:
Education, Health
Se ha actualizado:
23 abr 2017 año
Los indicadores de los cambios de valor en los últimos años
Mínimo:
51.015
1 ene 1965 año
Máximo:
68.053
1 ene 2012 año
A la fecha de observación
Valor
Cambio absoluto
El cambio con respecto al valor anterior
1 ene 1961 año
52.439
+52.439
0.0%
1 ene 1962 año
52.067
-0.372
-0.71%
1 ene 1963 año
51.619
-0.448
-0.86%
1 ene 1964 año
51.214
-0.405
-0.78%
1 ene 1965 año
51.015
-0.199
-0.39%
1 ene 1966 año
51.092
+0.077
0.15%
1 ene 1967 año
51.196
+0.104
0.2%
1 ene 1968 año
51.534
+0.338
0.66%
1 ene 1969 año
52.037
+0.502
0.97%
1 ene 1970 año
52.571
+0.534
1.03%
1 ene 1971 año
53.055
+0.485
0.92%
1 ene 1972 año
53.507
+0.451
0.85%
1 ene 1973 año
53.938
+0.431
0.81%
1 ene 1974 año
54.352
+0.414
0.77%
1 ene 1975 año
54.787
+0.434
0.8%
1 ene 1976 año
55.271
+0.484
0.88%
1 ene 1977 año
55.344
+0.073
0.13%
1 ene 1978 año
55.388
+0.044
0.08%
1 ene 1979 año
55.429
+0.041
0.07%
1 ene 1980 año
55.48
+0.052
0.09%
1 ene 1981 año
55.552
+0.071
0.13%
1 ene 1982 año
56.097
+0.546
0.98%
1 ene 1983 año
56.634
+0.537
0.96%
1 ene 1984 año
57.142
+0.508
0.9%
1 ene 1985 año
57.617
+0.475
0.83%
1 ene 1986 año
58.07
+0.453
0.79%
1 ene 1987 año
58.432
+0.363
0.62%
1 ene 1988 año
58.828
+0.395
0.68%
1 ene 1989 año
59.248
+0.42
0.71%
1 ene 1990 año
59.645
+0.397
0.67%
1 ene 1991 año
59.96
+0.315
0.53%
1 ene 1992 año
60.439
+0.479
0.8%
1 ene 1993 año
60.89
+0.45
0.75%
1 ene 1994 año
61.299
+0.41
0.67%
1 ene 1995 año
61.713
+0.414
0.68%
1 ene 1996 año
62.186
+0.473
0.77%
1 ene 1997 año
62.485
+0.299
0.48%
1 ene 1998 año
62.876
+0.391
0.63%
1 ene 1999 año
63.349
+0.473
0.75%
1 ene 2000 año
63.837
+0.488
0.77%
1 ene 2001 año
64.254
+0.417
0.65%
1 ene 2002 año
64.091
-0.163
-0.25%
1 ene 2003 año
64.038
-0.053
-0.08%
1 ene 2004 año
64.073
+0.035
0.05%
1 ene 2005 año
64.247
+0.174
0.27%
1 ene 2006 año
64.628
+0.381
0.59%
1 ene 2007 año
65.178
+0.55
0.85%
1 ene 2008 año
65.888
+0.71
1.09%
1 ene 2009 año
66.695
+0.807
1.22%
1 ene 2010 año
67.421
+0.726
1.09%
1 ene 2011 año
67.882
+0.461
0.68%
1 ene 2012 año
68.053
+0.171
0.25%
1 ene 2013 año
68.052
-0.001
0.0%
1 ene 2014 año
67.918
-0.134
-0.2%
1 ene 2015 año
67.81
-0.107
-0.16%
1 ene 2016 año
67.871
+0.061
0.09%
Ranking de los países por los datos estadísticos actuales


Comentarios: