29
/es/
es
AIzaSyAYiBZKx7MnpbEhh9jyipgxe19OcubqV5w
April 1, 2024
116496
Curacao
CUW
true
2
1
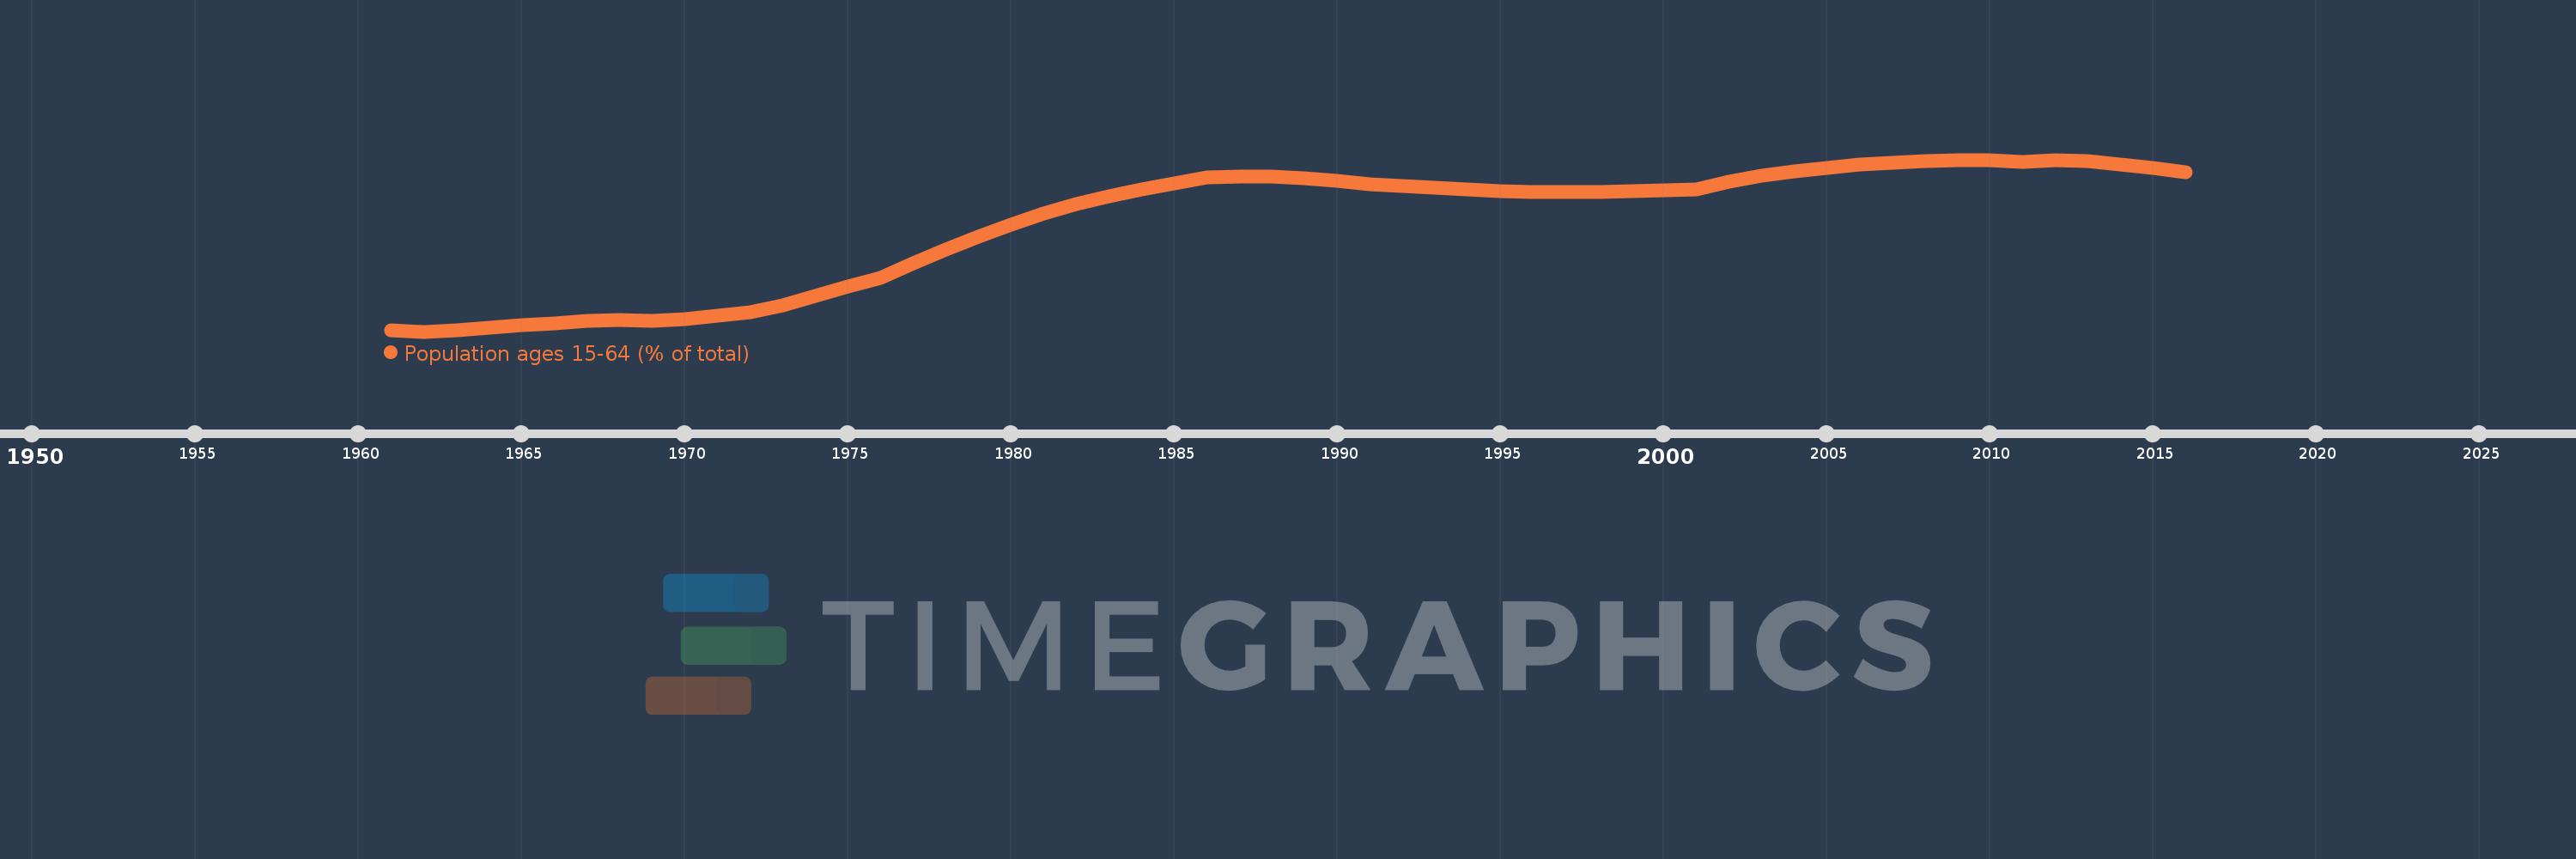
Population ages 15-64 (% of total)
2016,2015,2014,2013,2012,2011,2010,2009,2008,2007,2006,2005,2004,2003,2002,2001,2000,1999,1998,1997,1996,1995,1994,1993,1992,1991,1990,1989,1988,1987,1986,1985,1984,1983,1982,1981,1980,1979,1978,1977,1976,1975,1974,1973,1972,1971,1970,1969,1968,1967,1966,1965,1964,1963,1962,1961
Estas estadísticas en otros países:
AfghanistanAlbaniaAlgeriaAngolaAntigua and BarbudaArab WorldArgentinaArmeniaArubaAustraliaAustriaAzerbaijanBahamas, TheBahrainBangladeshBarbadosBelarusBelgiumBelizeBeninBhutanBoliviaBosnia and HerzegovinaBotswanaBrazilBrunei DarussalamBulgariaBurkina FasoBurundiCabo VerdeCambodiaCameroonCanadaCaribbean small statesCentral African RepublicCentral Europe and the BalticsChadChannel IslandsChileChinaColombiaComorosCongo, Dem. Rep.Congo, Rep.Costa RicaCote d'IvoireCroatiaCubaCuracaoCyprusCzech RepublicDenmarkDjiboutiDominican RepublicEarly-demographic dividendEast Asia & PacificEast Asia & Pacific (excluding high income)East Asia & Pacific (IDA & IBRD countries)EcuadorEgypt, Arab Rep.El SalvadorEquatorial GuineaEritreaEstoniaEthiopiaEuro areaEurope & Central AsiaEurope & Central Asia (excluding high income)Europe & Central Asia (IDA & IBRD countries)European UnionFijiFinlandFragile and conflict affected situationsFranceFrench PolynesiaGabonGambia, TheGeorgiaGermanyGhanaGreeceGrenadaGuamGuatemalaGuineaGuinea-BissauGuyanaHaitiHeavily indebted poor countries (HIPC)High incomeHondurasHong Kong SAR, ChinaHungaryIBRD onlyIcelandIDA & IBRD totalIDA blendIDA onlyIDA totalIndiaIndonesiaIran, Islamic Rep.IraqIrelandIsraelItalyJamaicaJapanJordanKazakhstanKenyaKiribatiKorea, Dem. People’s Rep.Korea, Rep.KosovoKuwaitKyrgyz RepublicLao PDRLate-demographic dividendLatin America & Caribbean Latin America & Caribbean (excluding high income)Latin America & the Caribbean (IDA & IBRD countries)LatviaLeast developed countries: UN classificationLebanonLesothoLiberiaLibyaLithuaniaLow & middle incomeLow incomeLower middle incomeLuxembourgMacao SAR, ChinaMacedonia, FYRMadagascarMalawiMalaysiaMaldivesMaliMaltaMauritaniaMauritiusMexicoMicronesia, Fed. Sts.Middle East & North AfricaMiddle East & North Africa (excluding high income)Middle East & North Africa (IDA & IBRD countries)Middle incomeMoldovaMongoliaMontenegroMoroccoMozambiqueMyanmarNamibiaNepalNetherlandsNew CaledoniaNew ZealandNicaraguaNigerNigeriaNorth AmericaNorwayOECD membersOmanOther small statesPacific island small statesPakistanPanamaPapua New GuineaParaguayPeruPhilippinesPolandPortugalPost-demographic dividendPre-demographic dividendPuerto RicoQatarRomaniaRussian FederationRwandaSamoaSao Tome and PrincipeSaudi ArabiaSenegalSerbiaSeychellesSierra LeoneSingaporeSlovak RepublicSloveniaSmall statesSolomon IslandsSomaliaSouth AfricaSouth AsiaSouth Asia (IDA & IBRD)South SudanSpainSri LankaSt. LuciaSt. Vincent and the GrenadinesSub-Saharan Africa Sub-Saharan Africa (excluding high income)Sub-Saharan Africa (IDA & IBRD countries)SudanSurinameSwazilandSwedenSwitzerlandSyrian Arab RepublicTajikistanTanzaniaThailandTimor-LesteTogoTongaTrinidad and TobagoTunisiaTurkeyTurkmenistanUgandaUkraineUnited Arab EmiratesUnited KingdomUnited StatesUpper middle incomeUruguayUzbekistanVanuatuVenezuela, RBVietnamVirgin Islands (U.S.)West Bank and GazaWorldYemen, Rep.ZambiaZimbabwe línea de tiempo (timeline):
En esta escala de tiempo se presenta un gráfico de 1961 y 2016 de Curacao. Los datos de 1960 están ausentes. El número de observaciones reales por fecha: 56.
Fuente (nombre):
Indicadores del desarrollo mundial
Fuente (organización):
World Bank staff estimates based on age distributions of United Nations Population Division's World Population Prospects.
Categorías:
Education, Health
Se ha actualizado:
23 abr 2017 año
Los indicadores de los cambios de valor en los últimos años
Mínimo:
53.823
1 ene 1962 año
Máximo:
67.126
1 ene 2012 año
A la fecha de observación
Valor
Cambio absoluto
El cambio con respecto al valor anterior
1 ene 1961 año
53.907
+53.907
0.0%
1 ene 1962 año
53.823
-0.084
-0.16%
1 ene 1963 año
53.932
+0.11
0.2%
1 ene 1964 año
54.128
+0.196
0.36%
1 ene 1965 año
54.309
+0.181
0.33%
1 ene 1966 año
54.455
+0.146
0.27%
1 ene 1967 año
54.667
+0.212
0.39%
1 ene 1968 año
54.707
+0.04
0.07%
1 ene 1969 año
54.684
-0.022
-0.04%
1 ene 1970 año
54.775
+0.091
0.17%
1 ene 1971 año
55.074
+0.299
0.55%
1 ene 1972 año
55.333
+0.258
0.47%
1 ene 1973 año
55.863
+0.53
0.96%
1 ene 1974 año
56.578
+0.714
1.28%
1 ene 1975 año
57.307
+0.73
1.29%
1 ene 1976 año
57.974
+0.666
1.16%
1 ene 1977 año
59.105
+1.131
1.95%
1 ene 1978 año
60.158
+1.054
1.78%
1 ene 1979 año
61.152
+0.994
1.65%
1 ene 1980 año
62.091
+0.939
1.54%
1 ene 1981 año
62.943
+0.852
1.37%
1 ene 1982 año
63.719
+0.776
1.23%
1 ene 1983 año
64.323
+0.604
0.95%
1 ene 1984 año
64.839
+0.516
0.8%
1 ene 1985 año
65.317
+0.478
0.74%
1 ene 1986 año
65.755
+0.438
0.67%
1 ene 1987 año
65.848
+0.093
0.14%
1 ene 1988 año
65.805
-0.043
-0.07%
1 ene 1989 año
65.671
-0.134
-0.2%
1 ene 1990 año
65.477
-0.194
-0.3%
1 ene 1991 año
65.243
-0.234
-0.36%
1 ene 1992 año
65.117
-0.126
-0.19%
1 ene 1993 año
64.97
-0.147
-0.23%
1 ene 1994 año
64.832
-0.138
-0.21%
1 ene 1995 año
64.708
-0.124
-0.19%
1 ene 1996 año
64.603
-0.106
-0.16%
1 ene 1997 año
64.638
+0.036
0.06%
1 ene 1998 año
64.66
+0.022
0.03%
1 ene 1999 año
64.717
+0.057
0.09%
1 ene 2000 año
64.789
+0.072
0.11%
1 ene 2001 año
64.825
+0.037
0.06%
1 ene 2002 año
65.46
+0.634
0.98%
1 ene 2003 año
65.892
+0.432
0.66%
1 ene 2004 año
66.22
+0.328
0.5%
1 ene 2005 año
66.525
+0.305
0.46%
1 ene 2006 año
66.785
+0.259
0.39%
1 ene 2007 año
66.861
+0.077
0.12%
1 ene 2008 año
66.994
+0.132
0.2%
1 ene 2009 año
67.117
+0.123
0.18%
1 ene 2010 año
67.117
0.0
0.0%
1 ene 2011 año
66.958
-0.158
-0.24%
1 ene 2012 año
67.126
+0.168
0.25%
1 ene 2013 año
67.04
-0.086
-0.13%
1 ene 2014 año
66.784
-0.256
-0.38%
1 ene 2015 año
66.479
-0.305
-0.46%
1 ene 2016 año
66.183
-0.297
-0.45%
Ranking de los países por los datos estadísticos actuales


Comentarios: