29
/es/
es
AIzaSyAYiBZKx7MnpbEhh9jyipgxe19OcubqV5w
April 1, 2024
62506
World
WLD
false
2
1
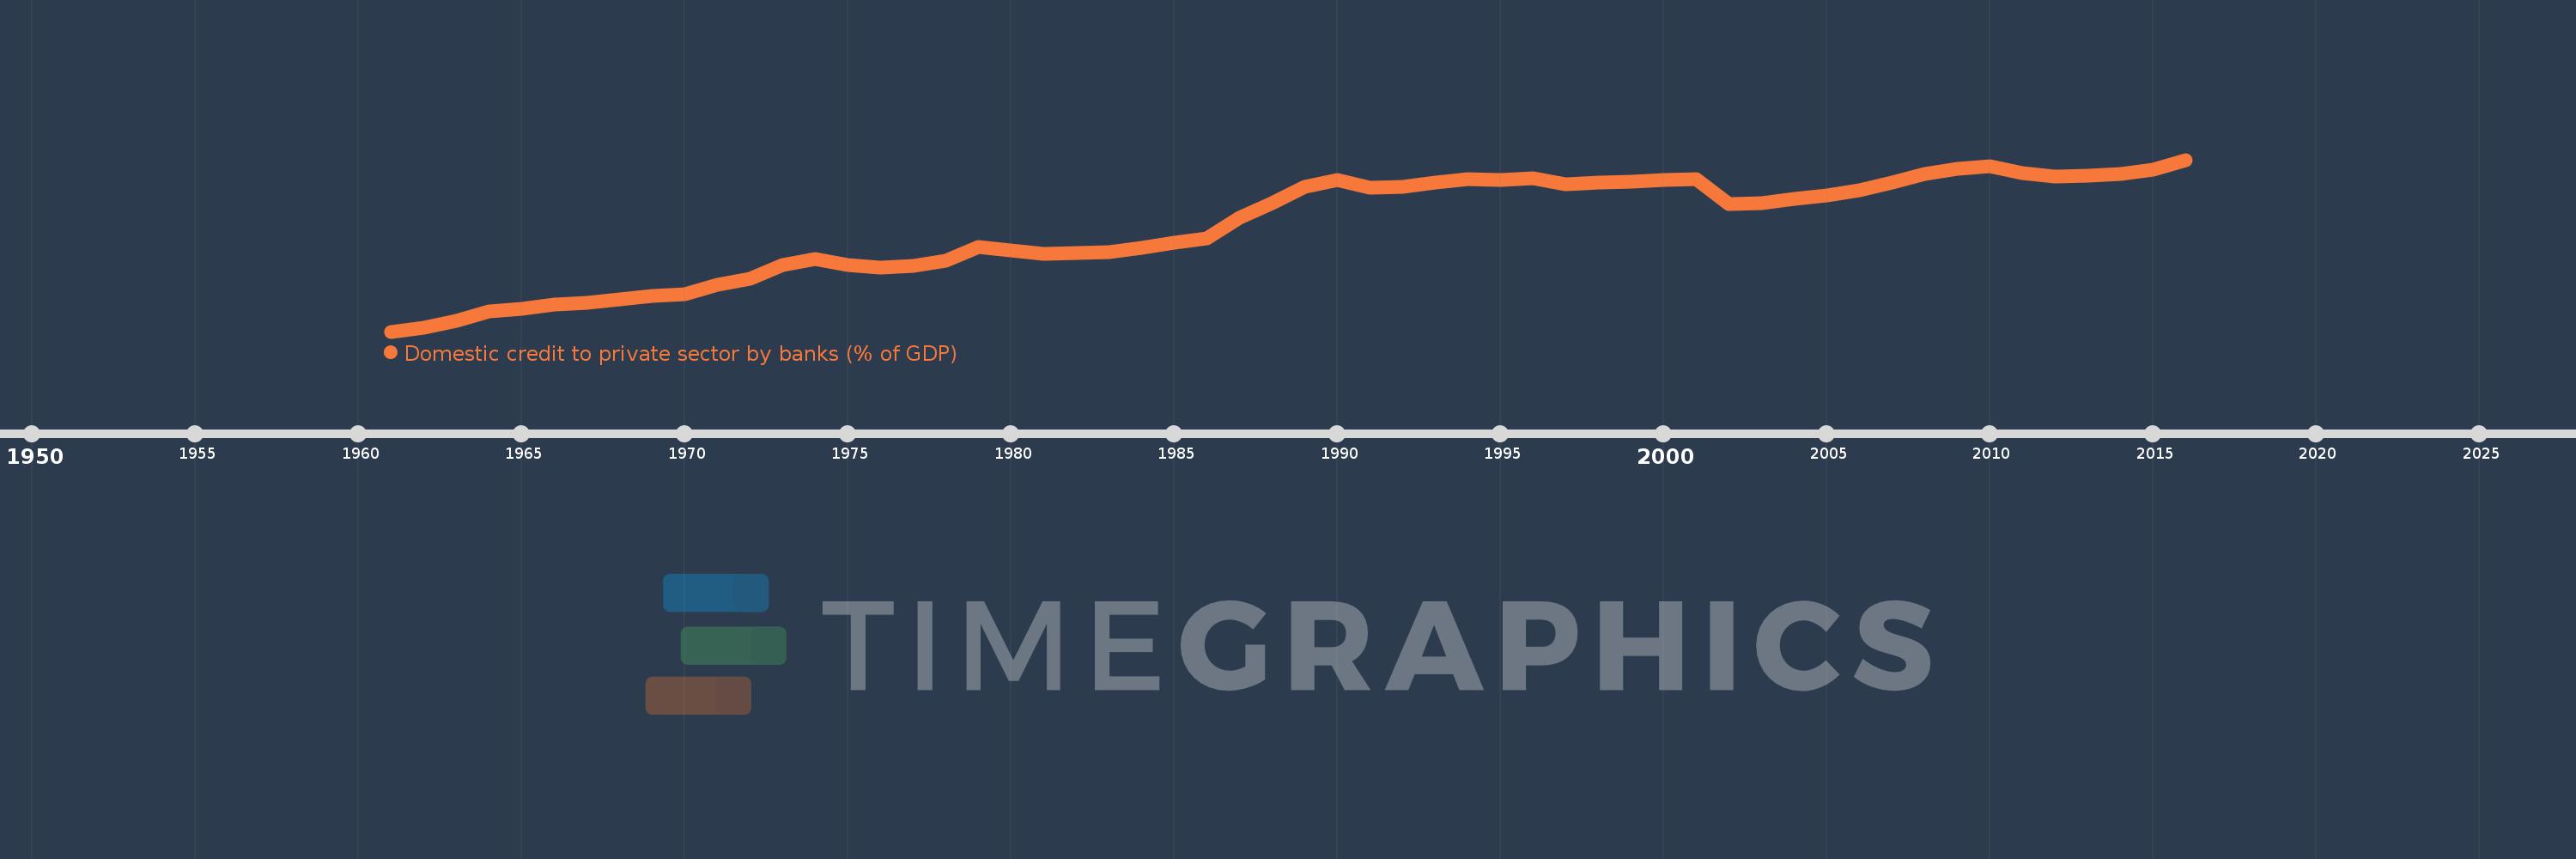
Domestic credit to private sector by banks (% of GDP)
2016,2015,2014,2013,2012,2011,2010,2009,2008,2007,2006,2005,2004,2003,2002,2001,2000,1999,1998,1997,1996,1995,1994,1993,1992,1991,1990,1989,1988,1987,1986,1985,1984,1983,1982,1981,1980,1979,1978,1977,1976,1975,1974,1973,1972,1971,1970,1969,1968,1967,1966,1965,1964,1963,1962,1961
Estas estadísticas en otros países:
AfghanistanAlbaniaAlgeriaAngolaAntigua and BarbudaArab WorldArgentinaArmeniaArubaAustraliaAustriaAzerbaijanBahamas, TheBahrainBangladeshBarbadosBelarusBelgiumBelizeBeninBhutanBoliviaBosnia and HerzegovinaBotswanaBrazilBrunei DarussalamBulgariaBurkina FasoBurundiCabo VerdeCambodiaCameroonCanadaCaribbean small statesCentral African RepublicCentral Europe and the BalticsChadChileChinaColombiaComorosCongo, Dem. Rep.Congo, Rep.Costa RicaCote d'IvoireCroatiaCyprusCzech RepublicDenmarkDjiboutiDominicaDominican RepublicEarly-demographic dividendEast Asia & PacificEast Asia & Pacific (excluding high income)East Asia & Pacific (IDA & IBRD countries)EcuadorEgypt, Arab Rep.El SalvadorEquatorial GuineaEritreaEstoniaEthiopiaEuro areaEurope & Central AsiaEurope & Central Asia (excluding high income)Europe & Central Asia (IDA & IBRD countries)European UnionFijiFinlandFragile and conflict affected situationsFranceGabonGambia, TheGeorgiaGermanyGhanaGreeceGrenadaGuatemalaGuineaGuinea-BissauGuyanaHaitiHeavily indebted poor countries (HIPC)High incomeHondurasHong Kong SAR, ChinaHungaryIBRD onlyIcelandIDA & IBRD totalIDA blendIDA onlyIDA totalIndiaIndonesiaIran, Islamic Rep.IraqIrelandIsraelItalyJamaicaJapanJordanKazakhstanKenyaKorea, Rep.KosovoKuwaitKyrgyz RepublicLao PDRLate-demographic dividendLatin America & Caribbean Latin America & Caribbean (excluding high income)Latin America & the Caribbean (IDA & IBRD countries)LatviaLeast developed countries: UN classificationLebanonLesothoLiberiaLibyaLithuaniaLow & middle incomeLow incomeLower middle incomeLuxembourgMacao SAR, ChinaMacedonia, FYRMadagascarMalawiMalaysiaMaldivesMaliMaltaMauritaniaMauritiusMexicoMicronesia, Fed. Sts.Middle East & North AfricaMiddle East & North Africa (excluding high income)Middle East & North Africa (IDA & IBRD countries)Middle incomeMoldovaMongoliaMontenegroMoroccoMozambiqueMyanmarNamibiaNepalNetherlandsNew ZealandNicaraguaNigerNigeriaNorth AmericaNorwayOECD membersOmanOther small statesPacific island small statesPakistanPanamaPapua New GuineaParaguayPeruPhilippinesPolandPortugalPost-demographic dividendPre-demographic dividendQatarRomaniaRussian FederationRwandaSamoaSao Tome and PrincipeSaudi ArabiaSenegalSerbiaSeychellesSierra LeoneSingaporeSlovak RepublicSloveniaSmall statesSolomon IslandsSouth AfricaSouth AsiaSouth Asia (IDA & IBRD)South SudanSpainSri LankaSt. Kitts and NevisSt. LuciaSt. Vincent and the GrenadinesSub-Saharan Africa Sub-Saharan Africa (excluding high income)Sub-Saharan Africa (IDA & IBRD countries)SudanSurinameSwazilandSwedenSwitzerlandSyrian Arab RepublicTajikistanTanzaniaThailandTimor-LesteTogoTongaTrinidad and TobagoTunisiaTurkeyUgandaUkraineUnited Arab EmiratesUnited KingdomUnited StatesUpper middle incomeUruguayVanuatuVenezuela, RBVietnamWest Bank and GazaWorldYemen, Rep.ZambiaZimbabwe línea de tiempo (timeline):
En esta escala de tiempo se presenta un gráfico de 1961 y 2016 de World. Los datos de 1960 están ausentes. El número de observaciones reales por fecha: 56.
Fuente (nombre):
Indicadores del desarrollo mundial
Fuente (organización):
International Monetary Fund, International Financial Statistics and data files, and World Bank and OECD GDP estimates.
Categorías:
Financial Sector
Se ha actualizado:
23 abr 2017 año
Los indicadores de los cambios de valor en los últimos años
Mínimo:
31.706
1 ene 1961 año
Máximo:
87.73
1 ene 2016 año
A la fecha de observación
Valor
Cambio absoluto
El cambio con respecto al valor anterior
1 ene 1961 año
31.706
+31.706
0.0%
1 ene 1962 año
33.013
+1.308
4.12%
1 ene 1963 año
35.27
+2.256
6.84%
1 ene 1964 año
38.31
+3.041
8.62%
1 ene 1965 año
39.121
+0.81
2.11%
1 ene 1966 año
40.541
+1.42
3.63%
1 ene 1967 año
41.224
+0.684
1.69%
1 ene 1968 año
42.325
+1.101
2.67%
1 ene 1969 año
43.3
+0.974
2.3%
1 ene 1970 año
43.963
+0.663
1.53%
1 ene 1971 año
46.858
+2.896
6.59%
1 ene 1972 año
48.809
+1.951
4.16%
1 ene 1973 año
53.479
+4.669
9.57%
1 ene 1974 año
55.46
+1.982
3.71%
1 ene 1975 año
53.437
-2.023
-3.65%
1 ene 1976 año
52.711
-0.726
-1.36%
1 ene 1977 año
53.098
+0.387
0.73%
1 ene 1978 año
54.686
+1.589
2.99%
1 ene 1979 año
59.234
+4.548
8.32%
1 ene 1980 año
58.242
-0.992
-1.67%
1 ene 1981 año
57.065
-1.177
-2.02%
1 ene 1982 año
57.307
+0.242
0.42%
1 ene 1983 año
57.605
+0.299
0.52%
1 ene 1984 año
59.141
+1.535
2.67%
1 ene 1985 año
60.748
+1.607
2.72%
1 ene 1986 año
62.109
+1.361
2.24%
1 ene 1987 año
68.828
+6.719
10.82%
1 ene 1988 año
73.492
+4.664
6.78%
1 ene 1989 año
79.032
+5.54
7.54%
1 ene 1990 año
81.14
+2.108
2.67%
1 ene 1991 año
78.669
-2.471
-3.05%
1 ene 1992 año
79.025
+0.356
0.45%
1 ene 1993 año
80.403
+1.378
1.74%
1 ene 1994 año
81.357
+0.954
1.19%
1 ene 1995 año
81.247
-0.109
-0.13%
1 ene 1996 año
81.798
+0.55
0.68%
1 ene 1997 año
79.607
-2.191
-2.68%
1 ene 1998 año
80.339
+0.733
0.92%
1 ene 1999 año
80.466
+0.127
0.16%
1 ene 2000 año
81.238
+0.772
0.96%
1 ene 2001 año
81.473
+0.235
0.29%
1 ene 2002 año
73.32
-8.153
-10.01%
1 ene 2003 año
73.473
+0.152
0.21%
1 ene 2004 año
74.966
+1.494
2.03%
1 ene 2005 año
76.043
+1.077
1.44%
1 ene 2006 año
77.921
+1.878
2.47%
1 ene 2007 año
80.263
+2.342
3.01%
1 ene 2008 año
83.208
+2.945
3.67%
1 ene 2009 año
84.765
+1.557
1.87%
1 ene 2010 año
85.669
+0.904
1.07%
1 ene 2011 año
83.33
-2.339
-2.73%
1 ene 2012 año
82.202
-1.128
-1.35%
1 ene 2013 año
82.502
+0.299
0.36%
1 ene 2014 año
83.224
+0.722
0.88%
1 ene 2015 año
84.515
+1.291
1.55%
1 ene 2016 año
87.73
+3.215
3.8%
Ranking de los países por los datos estadísticos actuales


Comentarios: