29
/es/
es
AIzaSyAYiBZKx7MnpbEhh9jyipgxe19OcubqV5w
April 1, 2024
126020
El Salvador
SLV
true
2
1
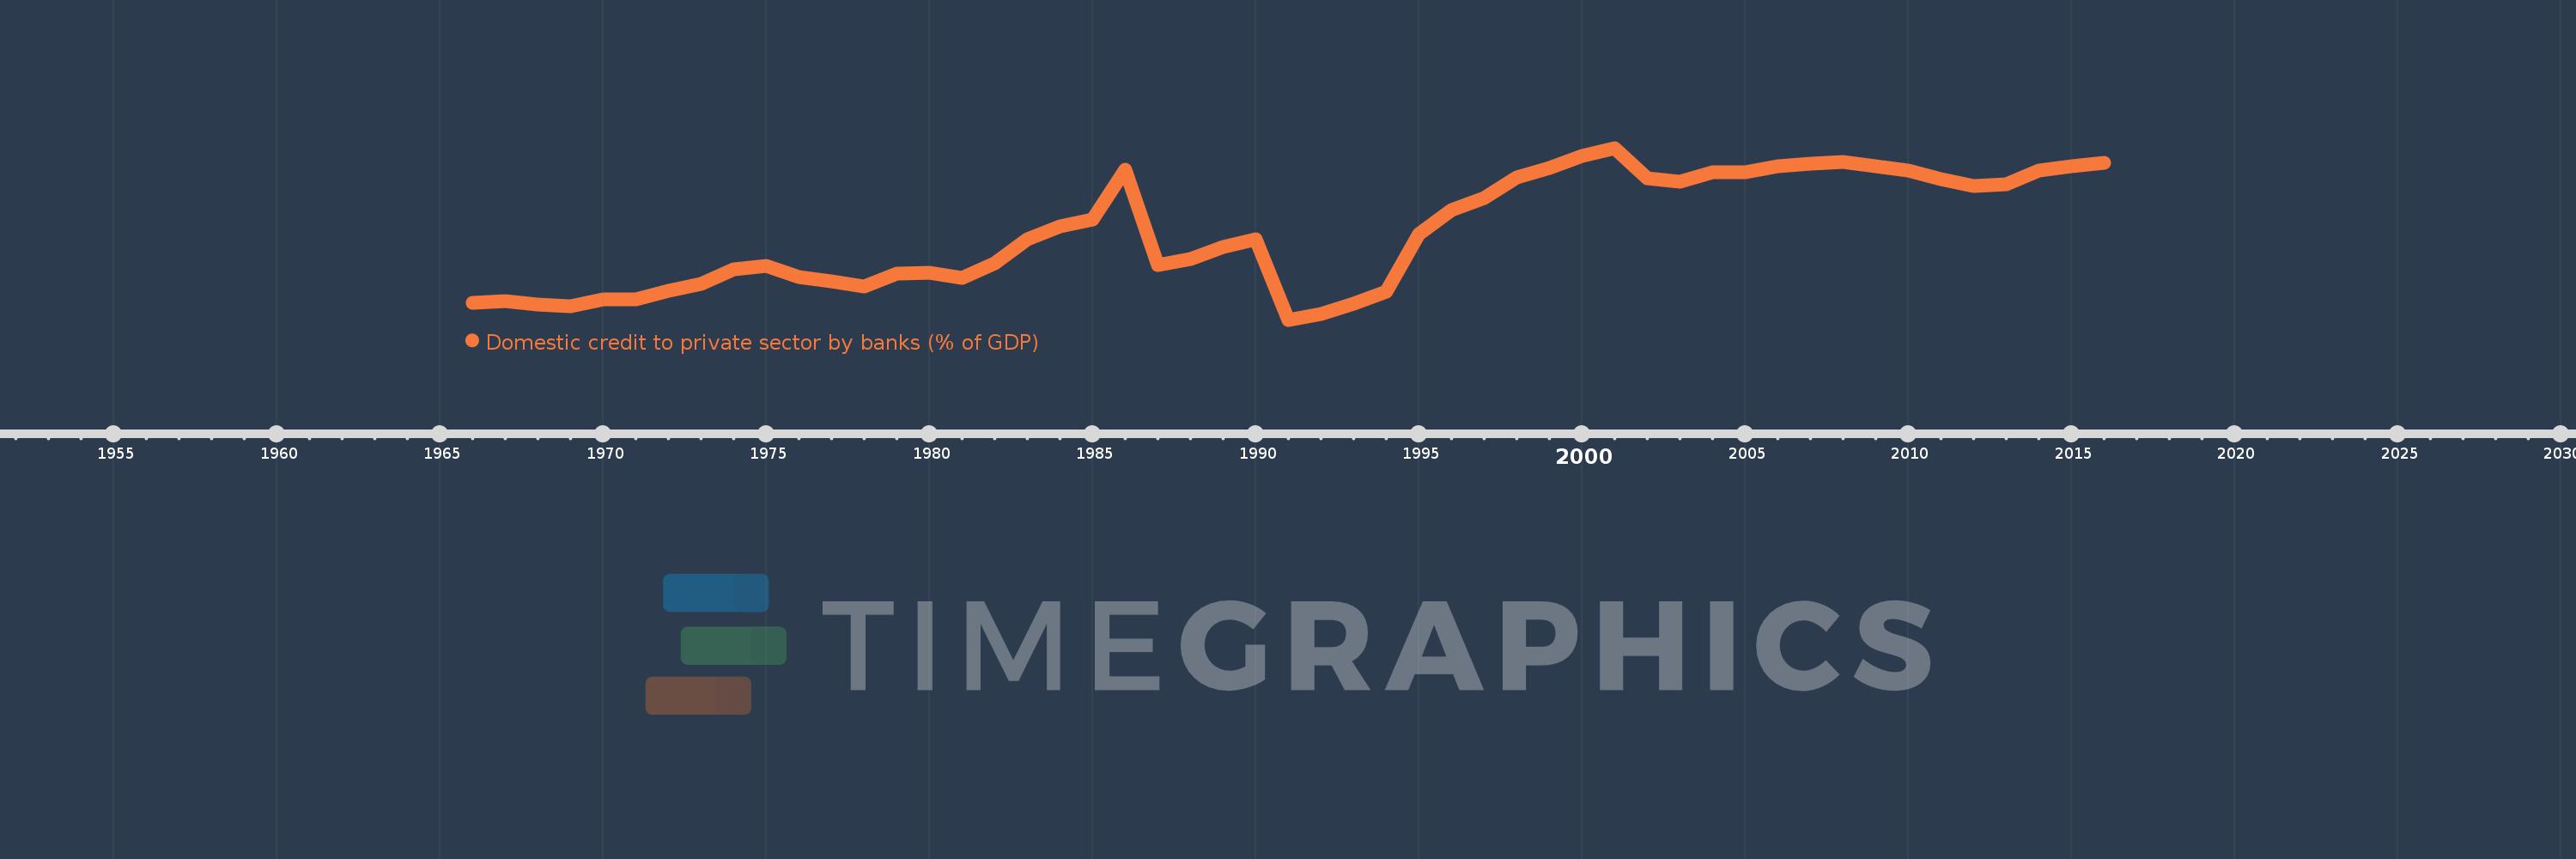
Domestic credit to private sector by banks (% of GDP)
2016,2015,2014,2013,2012,2011,2010,2009,2008,2007,2006,2005,2004,2003,2002,2001,2000,1999,1998,1997,1996,1995,1994,1993,1992,1991,1990,1989,1988,1987,1986,1985,1984,1983,1982,1981,1980,1979,1978,1977,1976,1975,1974,1973,1972,1971,1970,1969,1968,1967,1966
Estas estadísticas en otros países:
AfghanistanAlbaniaAlgeriaAngolaAntigua and BarbudaArab WorldArgentinaArmeniaArubaAustraliaAustriaAzerbaijanBahamas, TheBahrainBangladeshBarbadosBelarusBelgiumBelizeBeninBhutanBoliviaBosnia and HerzegovinaBotswanaBrazilBrunei DarussalamBulgariaBurkina FasoBurundiCabo VerdeCambodiaCameroonCanadaCaribbean small statesCentral African RepublicCentral Europe and the BalticsChadChileChinaColombiaComorosCongo, Dem. Rep.Congo, Rep.Costa RicaCote d'IvoireCroatiaCyprusCzech RepublicDenmarkDjiboutiDominicaDominican RepublicEarly-demographic dividendEast Asia & PacificEast Asia & Pacific (excluding high income)East Asia & Pacific (IDA & IBRD countries)EcuadorEgypt, Arab Rep.El SalvadorEquatorial GuineaEritreaEstoniaEthiopiaEuro areaEurope & Central AsiaEurope & Central Asia (excluding high income)Europe & Central Asia (IDA & IBRD countries)European UnionFijiFinlandFragile and conflict affected situationsFranceGabonGambia, TheGeorgiaGermanyGhanaGreeceGrenadaGuatemalaGuineaGuinea-BissauGuyanaHaitiHeavily indebted poor countries (HIPC)High incomeHondurasHong Kong SAR, ChinaHungaryIBRD onlyIcelandIDA & IBRD totalIDA blendIDA onlyIDA totalIndiaIndonesiaIran, Islamic Rep.IraqIrelandIsraelItalyJamaicaJapanJordanKazakhstanKenyaKorea, Rep.KosovoKuwaitKyrgyz RepublicLao PDRLate-demographic dividendLatin America & Caribbean Latin America & Caribbean (excluding high income)Latin America & the Caribbean (IDA & IBRD countries)LatviaLeast developed countries: UN classificationLebanonLesothoLiberiaLibyaLithuaniaLow & middle incomeLow incomeLower middle incomeLuxembourgMacao SAR, ChinaMacedonia, FYRMadagascarMalawiMalaysiaMaldivesMaliMaltaMauritaniaMauritiusMexicoMicronesia, Fed. Sts.Middle East & North AfricaMiddle East & North Africa (excluding high income)Middle East & North Africa (IDA & IBRD countries)Middle incomeMoldovaMongoliaMontenegroMoroccoMozambiqueMyanmarNamibiaNepalNetherlandsNew ZealandNicaraguaNigerNigeriaNorth AmericaNorwayOECD membersOmanOther small statesPacific island small statesPakistanPanamaPapua New GuineaParaguayPeruPhilippinesPolandPortugalPost-demographic dividendPre-demographic dividendQatarRomaniaRussian FederationRwandaSamoaSao Tome and PrincipeSaudi ArabiaSenegalSerbiaSeychellesSierra LeoneSingaporeSlovak RepublicSloveniaSmall statesSolomon IslandsSouth AfricaSouth AsiaSouth Asia (IDA & IBRD)South SudanSpainSri LankaSt. Kitts and NevisSt. LuciaSt. Vincent and the GrenadinesSub-Saharan Africa Sub-Saharan Africa (excluding high income)Sub-Saharan Africa (IDA & IBRD countries)SudanSurinameSwazilandSwedenSwitzerlandSyrian Arab RepublicTajikistanTanzaniaThailandTimor-LesteTogoTongaTrinidad and TobagoTunisiaTurkeyUgandaUkraineUnited Arab EmiratesUnited KingdomUnited StatesUpper middle incomeUruguayVanuatuVenezuela, RBVietnamWest Bank and GazaWorldYemen, Rep.ZambiaZimbabwe línea de tiempo (timeline):
En esta escala de tiempo se presenta un gráfico de 1966 y 2016 de El Salvador. Los datos de 1965 están ausentes. El número de observaciones reales por fecha: 51.
Fuente (nombre):
Indicadores del desarrollo mundial
Fuente (organización):
International Monetary Fund, International Financial Statistics and data files, and World Bank and OECD GDP estimates.
Categorías:
Financial Sector
Se ha actualizado:
23 abr 2017 año
Los indicadores de los cambios de valor en los últimos años
Mínimo:
16.892
1 ene 1991 año
Máximo:
45.137
1 ene 2001 año
A la fecha de observación
Valor
Cambio absoluto
El cambio con respecto al valor anterior
1 ene 1966 año
19.65
+19.65
0.0%
1 ene 1967 año
19.938
+0.288
1.47%
1 ene 1968 año
19.348
-0.59
-2.96%
1 ene 1969 año
19.045
-0.303
-1.57%
1 ene 1970 año
20.288
+1.243
6.53%
1 ene 1971 año
20.241
-0.047
-0.23%
1 ene 1972 año
21.587
+1.346
6.65%
1 ene 1973 año
22.779
+1.192
5.52%
1 ene 1974 año
25.2
+2.42
10.62%
1 ene 1975 año
25.735
+0.535
2.12%
1 ene 1976 año
23.952
-1.783
-6.93%
1 ene 1977 año
23.201
-0.751
-3.13%
1 ene 1978 año
22.397
-0.804
-3.46%
1 ene 1979 año
24.48
+2.082
9.3%
1 ene 1980 año
24.573
+0.093
0.38%
1 ene 1981 año
23.776
-0.797
-3.24%
1 ene 1982 año
26.109
+2.333
9.81%
1 ene 1983 año
30.112
+4.003
15.33%
1 ene 1984 año
32.311
+2.199
7.3%
1 ene 1985 año
33.381
+1.071
3.31%
1 ene 1986 año
41.545
+8.164
24.46%
1 ene 1987 año
25.909
-15.636
-37.64%
1 ene 1988 año
26.865
+0.956
3.69%
1 ene 1989 año
28.798
+1.933
7.2%
1 ene 1990 año
30.067
+1.269
4.41%
1 ene 1991 año
16.892
-13.175
-43.82%
1 ene 1992 año
17.799
+0.907
5.37%
1 ene 1993 año
19.58
+1.781
10.01%
1 ene 1994 año
21.531
+1.951
9.96%
1 ene 1995 año
30.978
+9.447
43.88%
1 ene 1996 año
34.885
+3.907
12.61%
1 ene 1997 año
36.837
+1.952
5.59%
1 ene 1998 año
40.295
+3.459
9.39%
1 ene 1999 año
41.873
+1.578
3.92%
1 ene 2000 año
43.763
+1.89
4.51%
1 ene 2001 año
45.137
+1.374
3.14%
1 ene 2002 año
40.083
-5.055
-11.2%
1 ene 2003 año
39.583
-0.499
-1.25%
1 ene 2004 año
41.2
+1.616
4.08%
1 ene 2005 año
41.154
-0.045
-0.11%
1 ene 2006 año
42.185
+1.03
2.5%
1 ene 2007 año
42.623
+0.438
1.04%
1 ene 2008 año
42.86
+0.237
0.56%
1 ene 2009 año
42.074
-0.786
-1.83%
1 ene 2010 año
41.487
-0.587
-1.4%
1 ene 2011 año
39.962
-1.525
-3.68%
1 ene 2012 año
38.826
-1.136
-2.84%
1 ene 2013 año
39.188
+0.363
0.93%
1 ene 2014 año
41.387
+2.198
5.61%
1 ene 2015 año
42.065
+0.678
1.64%
1 ene 2016 año
42.663
+0.598
1.42%
Ranking de los países por los datos estadísticos actuales


Comentarios: