29
/es/
es
AIzaSyAYiBZKx7MnpbEhh9jyipgxe19OcubqV5w
April 1, 2024
222030
Peru
PER
true
2
1
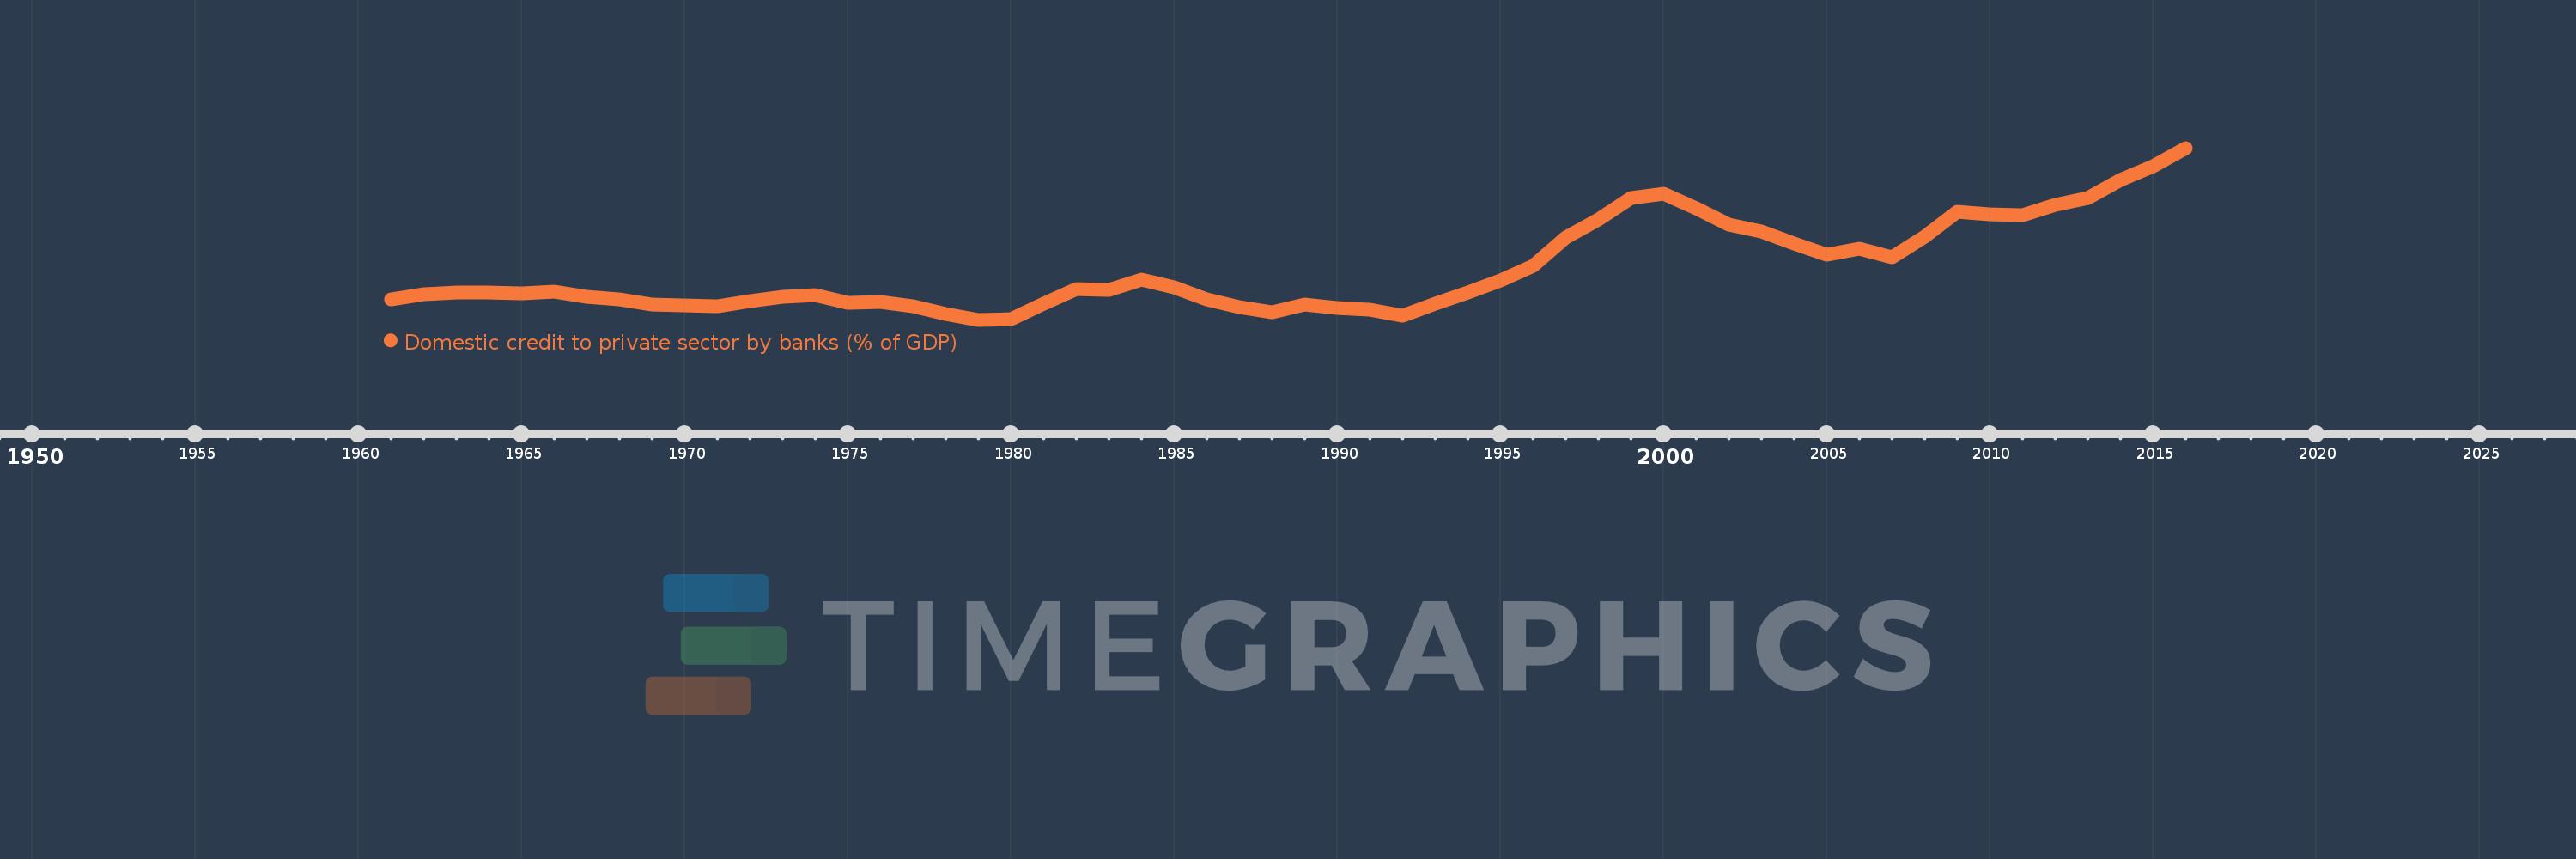
Domestic credit to private sector by banks (% of GDP)
2016,2015,2014,2013,2012,2011,2010,2009,2008,2007,2006,2005,2004,2003,2002,2001,2000,1999,1998,1997,1996,1995,1994,1993,1992,1991,1990,1989,1988,1987,1986,1985,1984,1983,1982,1981,1980,1979,1978,1977,1976,1975,1974,1973,1972,1971,1970,1969,1968,1967,1966,1965,1964,1963,1962,1961
Estas estadísticas en otros países:
AfghanistanAlbaniaAlgeriaAngolaAntigua and BarbudaArab WorldArgentinaArmeniaArubaAustraliaAustriaAzerbaijanBahamas, TheBahrainBangladeshBarbadosBelarusBelgiumBelizeBeninBhutanBoliviaBosnia and HerzegovinaBotswanaBrazilBrunei DarussalamBulgariaBurkina FasoBurundiCabo VerdeCambodiaCameroonCanadaCaribbean small statesCentral African RepublicCentral Europe and the BalticsChadChileChinaColombiaComorosCongo, Dem. Rep.Congo, Rep.Costa RicaCote d'IvoireCroatiaCyprusCzech RepublicDenmarkDjiboutiDominicaDominican RepublicEarly-demographic dividendEast Asia & PacificEast Asia & Pacific (excluding high income)East Asia & Pacific (IDA & IBRD countries)EcuadorEgypt, Arab Rep.El SalvadorEquatorial GuineaEritreaEstoniaEthiopiaEuro areaEurope & Central AsiaEurope & Central Asia (excluding high income)Europe & Central Asia (IDA & IBRD countries)European UnionFijiFinlandFragile and conflict affected situationsFranceGabonGambia, TheGeorgiaGermanyGhanaGreeceGrenadaGuatemalaGuineaGuinea-BissauGuyanaHaitiHeavily indebted poor countries (HIPC)High incomeHondurasHong Kong SAR, ChinaHungaryIBRD onlyIcelandIDA & IBRD totalIDA blendIDA onlyIDA totalIndiaIndonesiaIran, Islamic Rep.IraqIrelandIsraelItalyJamaicaJapanJordanKazakhstanKenyaKorea, Rep.KosovoKuwaitKyrgyz RepublicLao PDRLate-demographic dividendLatin America & Caribbean Latin America & Caribbean (excluding high income)Latin America & the Caribbean (IDA & IBRD countries)LatviaLeast developed countries: UN classificationLebanonLesothoLiberiaLibyaLithuaniaLow & middle incomeLow incomeLower middle incomeLuxembourgMacao SAR, ChinaMacedonia, FYRMadagascarMalawiMalaysiaMaldivesMaliMaltaMauritaniaMauritiusMexicoMicronesia, Fed. Sts.Middle East & North AfricaMiddle East & North Africa (excluding high income)Middle East & North Africa (IDA & IBRD countries)Middle incomeMoldovaMongoliaMontenegroMoroccoMozambiqueMyanmarNamibiaNepalNetherlandsNew ZealandNicaraguaNigerNigeriaNorth AmericaNorwayOECD membersOmanOther small statesPacific island small statesPakistanPanamaPapua New GuineaParaguayPeruPhilippinesPolandPortugalPost-demographic dividendPre-demographic dividendQatarRomaniaRussian FederationRwandaSamoaSao Tome and PrincipeSaudi ArabiaSenegalSerbiaSeychellesSierra LeoneSingaporeSlovak RepublicSloveniaSmall statesSolomon IslandsSouth AfricaSouth AsiaSouth Asia (IDA & IBRD)South SudanSpainSri LankaSt. Kitts and NevisSt. LuciaSt. Vincent and the GrenadinesSub-Saharan Africa Sub-Saharan Africa (excluding high income)Sub-Saharan Africa (IDA & IBRD countries)SudanSurinameSwazilandSwedenSwitzerlandSyrian Arab RepublicTajikistanTanzaniaThailandTimor-LesteTogoTongaTrinidad and TobagoTunisiaTurkeyUgandaUkraineUnited Arab EmiratesUnited KingdomUnited StatesUpper middle incomeUruguayVanuatuVenezuela, RBVietnamWest Bank and GazaWorldYemen, Rep.ZambiaZimbabwe línea de tiempo (timeline):
En esta escala de tiempo se presenta un gráfico de 1961 y 2016 de Peru. Los datos de 1960 están ausentes. El número de observaciones reales por fecha: 56.
Fuente (nombre):
Indicadores del desarrollo mundial
Fuente (organización):
International Monetary Fund, International Financial Statistics and data files, and World Bank and OECD GDP estimates.
Categorías:
Financial Sector
Se ha actualizado:
23 abr 2017 año
Los indicadores de los cambios de valor en los últimos años
Mínimo:
6.088
1 ene 1979 año
Máximo:
37.356
1 ene 2016 año
A la fecha de observación
Valor
Cambio absoluto
El cambio con respecto al valor anterior
1 ene 1961 año
9.827
+9.827
0.0%
1 ene 1962 año
10.681
+0.853
8.68%
1 ene 1963 año
11.012
+0.331
3.1%
1 ene 1964 año
11.087
+0.075
0.68%
1 ene 1965 año
10.877
-0.211
-1.9%
1 ene 1966 año
11.194
+0.317
2.92%
1 ene 1967 año
10.315
-0.879
-7.85%
1 ene 1968 año
9.82
-0.494
-4.79%
1 ene 1969 año
8.919
-0.901
-9.17%
1 ene 1970 año
8.733
-0.187
-2.09%
1 ene 1971 año
8.588
-0.145
-1.66%
1 ene 1972 año
9.414
+0.826
9.62%
1 ene 1973 año
10.32
+0.906
9.62%
1 ene 1974 año
10.553
+0.233
2.26%
1 ene 1975 año
9.192
-1.36
-12.89%
1 ene 1976 año
9.319
+0.127
1.38%
1 ene 1977 año
8.494
-0.825
-8.86%
1 ene 1978 año
7.134
-1.36
-16.02%
1 ene 1979 año
6.088
-1.046
-14.66%
1 ene 1980 año
6.134
+0.046
0.75%
1 ene 1981 año
8.948
+2.815
45.89%
1 ene 1982 año
11.627
+2.679
29.93%
1 ene 1983 año
11.551
-0.076
-0.66%
1 ene 1984 año
13.378
+1.827
15.82%
1 ene 1985 año
12.003
-1.375
-10.28%
1 ene 1986 año
9.726
-2.276
-18.97%
1 ene 1987 año
8.424
-1.303
-13.39%
1 ene 1988 año
7.455
-0.969
-11.5%
1 ene 1989 año
8.805
+1.35
18.11%
1 ene 1990 año
8.238
-0.568
-6.45%
1 ene 1991 año
7.986
-0.251
-3.05%
1 ene 1992 año
6.884
-1.102
-13.8%
1 ene 1993 año
9.019
+2.135
31.01%
1 ene 1994 año
11.002
+1.983
21.99%
1 ene 1995 año
13.284
+2.281
20.74%
1 ene 1996 año
15.874
+2.59
19.5%
1 ene 1997 año
21.025
+5.151
32.45%
1 ene 1998 año
24.41
+3.384
16.1%
1 ene 1999 año
28.191
+3.781
15.49%
1 ene 2000 año
28.977
+0.786
2.79%
1 ene 2001 año
26.342
-2.636
-9.1%
1 ene 2002 año
23.448
-2.894
-10.99%
1 ene 2003 año
22.202
-1.246
-5.31%
1 ene 2004 año
19.986
-2.216
-9.98%
1 ene 2005 año
17.91
-2.076
-10.38%
1 ene 2006 año
19.066
+1.156
6.46%
1 ene 2007 año
17.493
-1.573
-8.25%
1 ene 2008 año
21.177
+3.684
21.06%
1 ene 2009 año
25.69
+4.513
21.31%
1 ene 2010 año
25.215
-0.475
-1.85%
1 ene 2011 año
25.168
-0.047
-0.19%
1 ene 2012 año
26.973
+1.805
7.17%
1 ene 2013 año
28.217
+1.245
4.61%
1 ene 2014 año
31.591
+3.374
11.96%
1 ene 2015 año
34.062
+2.471
7.82%
1 ene 2016 año
37.356
+3.294
9.67%
Ranking de los países por los datos estadísticos actuales


Comentarios: