29
/es/
es
AIzaSyAYiBZKx7MnpbEhh9jyipgxe19OcubqV5w
April 1, 2024
190103
Mali
MLI
true
2
1
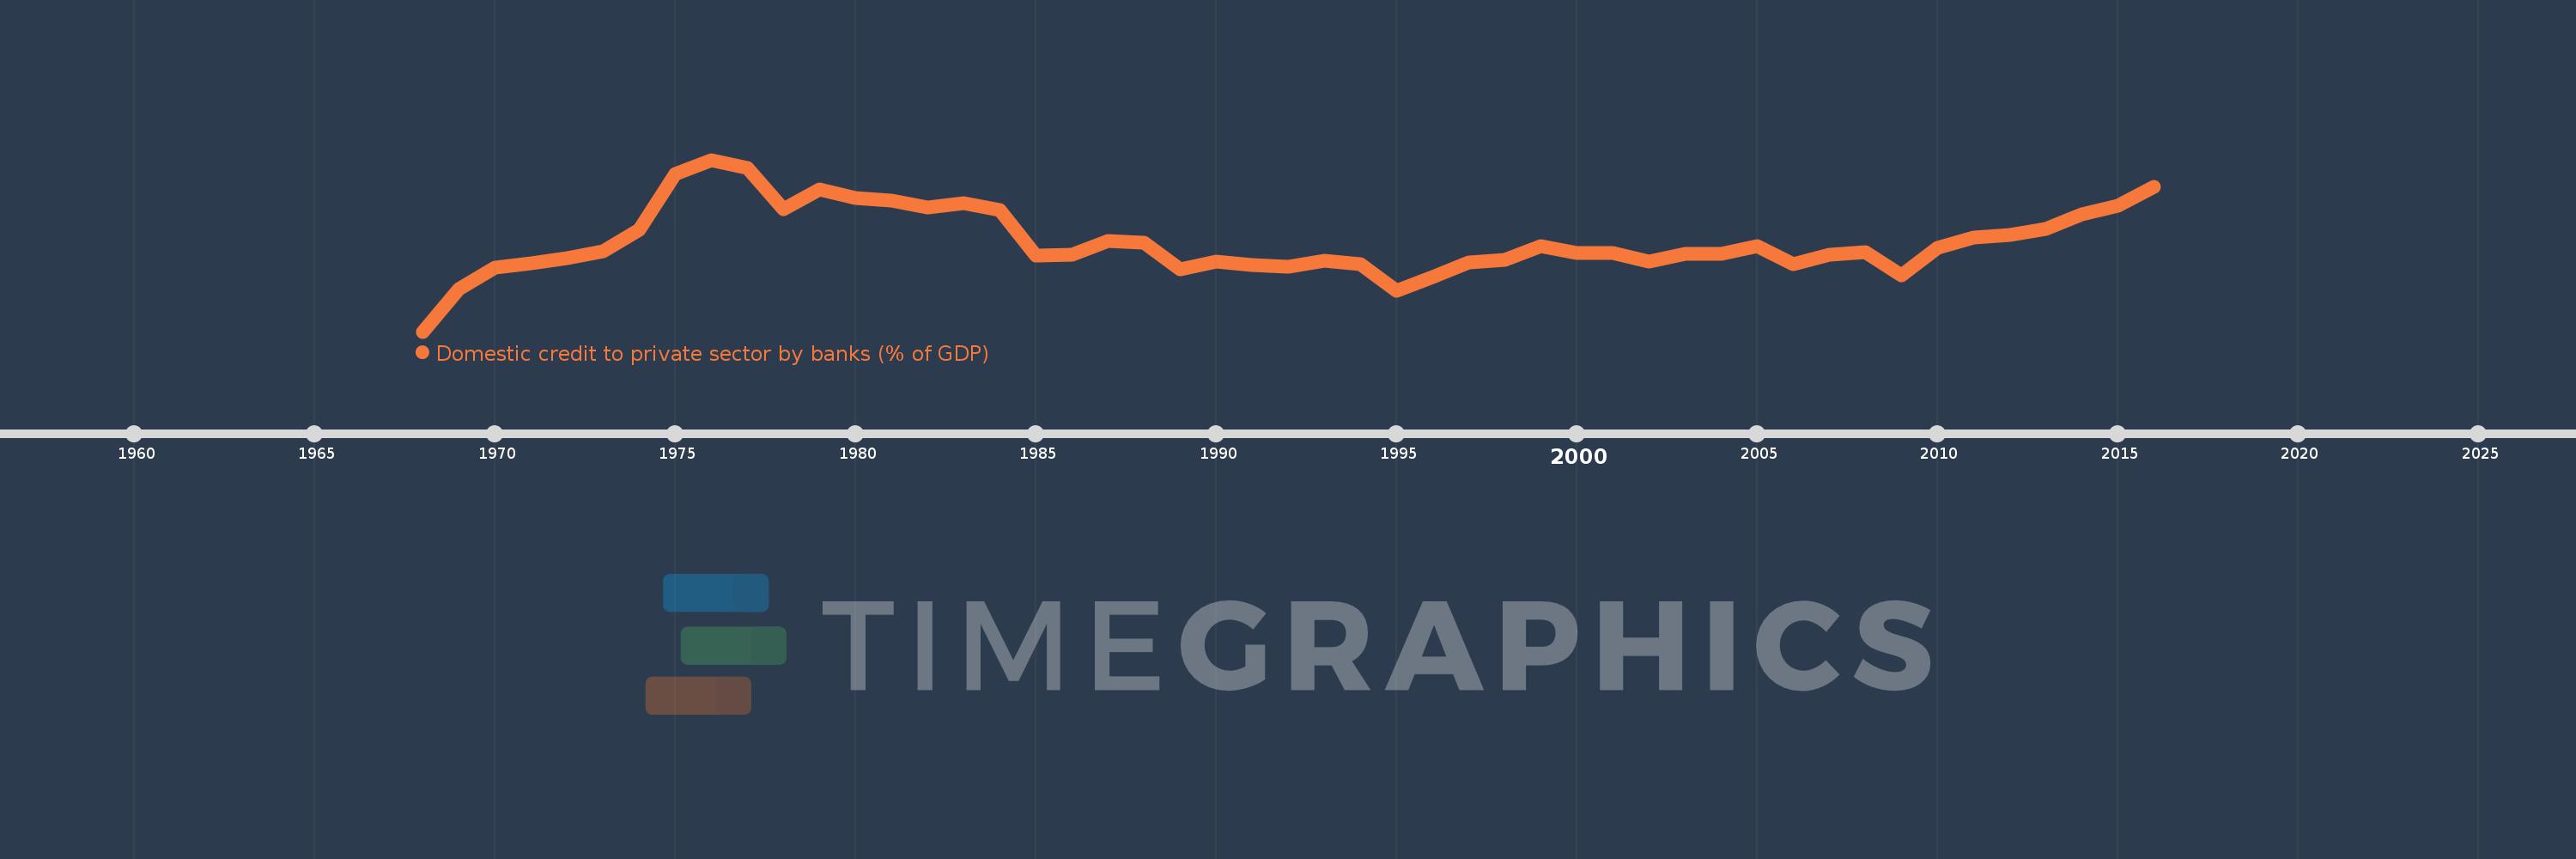
Domestic credit to private sector by banks (% of GDP)
2016,2015,2014,2013,2012,2011,2010,2009,2008,2007,2006,2005,2004,2003,2002,2001,2000,1999,1998,1997,1996,1995,1994,1993,1992,1991,1990,1989,1988,1987,1986,1985,1984,1983,1982,1981,1980,1979,1978,1977,1976,1975,1974,1973,1972,1971,1970,1969,1968
Estas estadísticas en otros países:
AfghanistanAlbaniaAlgeriaAngolaAntigua and BarbudaArab WorldArgentinaArmeniaArubaAustraliaAustriaAzerbaijanBahamas, TheBahrainBangladeshBarbadosBelarusBelgiumBelizeBeninBhutanBoliviaBosnia and HerzegovinaBotswanaBrazilBrunei DarussalamBulgariaBurkina FasoBurundiCabo VerdeCambodiaCameroonCanadaCaribbean small statesCentral African RepublicCentral Europe and the BalticsChadChileChinaColombiaComorosCongo, Dem. Rep.Congo, Rep.Costa RicaCote d'IvoireCroatiaCyprusCzech RepublicDenmarkDjiboutiDominicaDominican RepublicEarly-demographic dividendEast Asia & PacificEast Asia & Pacific (excluding high income)East Asia & Pacific (IDA & IBRD countries)EcuadorEgypt, Arab Rep.El SalvadorEquatorial GuineaEritreaEstoniaEthiopiaEuro areaEurope & Central AsiaEurope & Central Asia (excluding high income)Europe & Central Asia (IDA & IBRD countries)European UnionFijiFinlandFragile and conflict affected situationsFranceGabonGambia, TheGeorgiaGermanyGhanaGreeceGrenadaGuatemalaGuineaGuinea-BissauGuyanaHaitiHeavily indebted poor countries (HIPC)High incomeHondurasHong Kong SAR, ChinaHungaryIBRD onlyIcelandIDA & IBRD totalIDA blendIDA onlyIDA totalIndiaIndonesiaIran, Islamic Rep.IraqIrelandIsraelItalyJamaicaJapanJordanKazakhstanKenyaKorea, Rep.KosovoKuwaitKyrgyz RepublicLao PDRLate-demographic dividendLatin America & Caribbean Latin America & Caribbean (excluding high income)Latin America & the Caribbean (IDA & IBRD countries)LatviaLeast developed countries: UN classificationLebanonLesothoLiberiaLibyaLithuaniaLow & middle incomeLow incomeLower middle incomeLuxembourgMacao SAR, ChinaMacedonia, FYRMadagascarMalawiMalaysiaMaldivesMaliMaltaMauritaniaMauritiusMexicoMicronesia, Fed. Sts.Middle East & North AfricaMiddle East & North Africa (excluding high income)Middle East & North Africa (IDA & IBRD countries)Middle incomeMoldovaMongoliaMontenegroMoroccoMozambiqueMyanmarNamibiaNepalNetherlandsNew ZealandNicaraguaNigerNigeriaNorth AmericaNorwayOECD membersOmanOther small statesPacific island small statesPakistanPanamaPapua New GuineaParaguayPeruPhilippinesPolandPortugalPost-demographic dividendPre-demographic dividendQatarRomaniaRussian FederationRwandaSamoaSao Tome and PrincipeSaudi ArabiaSenegalSerbiaSeychellesSierra LeoneSingaporeSlovak RepublicSloveniaSmall statesSolomon IslandsSouth AfricaSouth AsiaSouth Asia (IDA & IBRD)South SudanSpainSri LankaSt. Kitts and NevisSt. LuciaSt. Vincent and the GrenadinesSub-Saharan Africa Sub-Saharan Africa (excluding high income)Sub-Saharan Africa (IDA & IBRD countries)SudanSurinameSwazilandSwedenSwitzerlandSyrian Arab RepublicTajikistanTanzaniaThailandTimor-LesteTogoTongaTrinidad and TobagoTunisiaTurkeyUgandaUkraineUnited Arab EmiratesUnited KingdomUnited StatesUpper middle incomeUruguayVanuatuVenezuela, RBVietnamWest Bank and GazaWorldYemen, Rep.ZambiaZimbabwe línea de tiempo (timeline):
En esta escala de tiempo se presenta un gráfico de 1968 y 2016 de Mali. Los datos de 1967 están ausentes. El número de observaciones reales por fecha: 49.
Fuente (nombre):
Indicadores del desarrollo mundial
Fuente (organización):
International Monetary Fund, International Financial Statistics and data files, and World Bank and OECD GDP estimates.
Categorías:
Financial Sector
Se ha actualizado:
23 abr 2017 año
Los indicadores de los cambios de valor en los últimos años
Mínimo:
0.716
1 ene 1968 año
Máximo:
28.689
1 ene 1976 año
A la fecha de observación
Valor
Cambio absoluto
El cambio con respecto al valor anterior
1 ene 1968 año
0.716
+0.716
0.0%
1 ene 1969 año
7.632
+6.916
966.42%
1 ene 1970 año
11.08
+3.449
45.19%
1 ene 1971 año
11.805
+0.725
6.54%
1 ene 1972 año
12.715
+0.91
7.71%
1 ene 1973 año
13.832
+1.117
8.78%
1 ene 1974 año
17.224
+3.392
24.52%
1 ene 1975 año
26.312
+9.088
52.77%
1 ene 1976 año
28.689
+2.377
9.03%
1 ene 1977 año
27.312
-1.377
-4.8%
1 ene 1978 año
20.682
-6.63
-24.27%
1 ene 1979 año
23.841
+3.159
15.27%
1 ene 1980 año
22.42
-1.421
-5.96%
1 ene 1981 año
22.053
-0.367
-1.64%
1 ene 1982 año
20.896
-1.158
-5.25%
1 ene 1983 año
21.674
+0.778
3.73%
1 ene 1984 año
20.553
-1.121
-5.17%
1 ene 1985 año
13.04
-7.513
-36.55%
1 ene 1986 año
13.303
+0.262
2.01%
1 ene 1987 año
15.509
+2.206
16.58%
1 ene 1988 año
15.158
-0.351
-2.26%
1 ene 1989 año
10.867
-4.291
-28.31%
1 ene 1990 año
12.085
+1.218
11.21%
1 ene 1991 año
11.52
-0.566
-4.68%
1 ene 1992 año
11.221
-0.299
-2.59%
1 ene 1993 año
12.261
+1.041
9.27%
1 ene 1994 año
11.753
-0.508
-4.15%
1 ene 1995 año
7.341
-4.412
-37.54%
1 ene 1996 año
9.643
+2.302
31.36%
1 ene 1997 año
12.033
+2.39
24.79%
1 ene 1998 año
12.444
+0.411
3.41%
1 ene 1999 año
14.567
+2.123
17.06%
1 ene 2000 año
13.53
-1.037
-7.12%
1 ene 2001 año
13.485
-0.045
-0.33%
1 ene 2002 año
12.078
-1.407
-10.44%
1 ene 2003 año
13.31
+1.232
10.2%
1 ene 2004 año
13.443
+0.133
1.0%
1 ene 2005 año
14.687
+1.244
9.25%
1 ene 2006 año
11.704
-2.983
-20.31%
1 ene 2007 año
13.197
+1.493
12.76%
1 ene 2008 año
13.647
+0.45
3.41%
1 ene 2009 año
9.88
-3.767
-27.6%
1 ene 2010 año
14.335
+4.455
45.09%
1 ene 2011 año
15.973
+1.637
11.42%
1 ene 2012 año
16.5
+0.527
3.3%
1 ene 2013 año
17.462
+0.962
5.83%
1 ene 2014 año
19.746
+2.284
13.08%
1 ene 2015 año
21.178
+1.432
7.25%
1 ene 2016 año
24.332
+3.155
14.9%
Ranking de los países por los datos estadísticos actuales


Comentarios: