29
/es/
es
AIzaSyAYiBZKx7MnpbEhh9jyipgxe19OcubqV5w
April 1, 2024
130317
Ethiopia
ETH
true
2
1
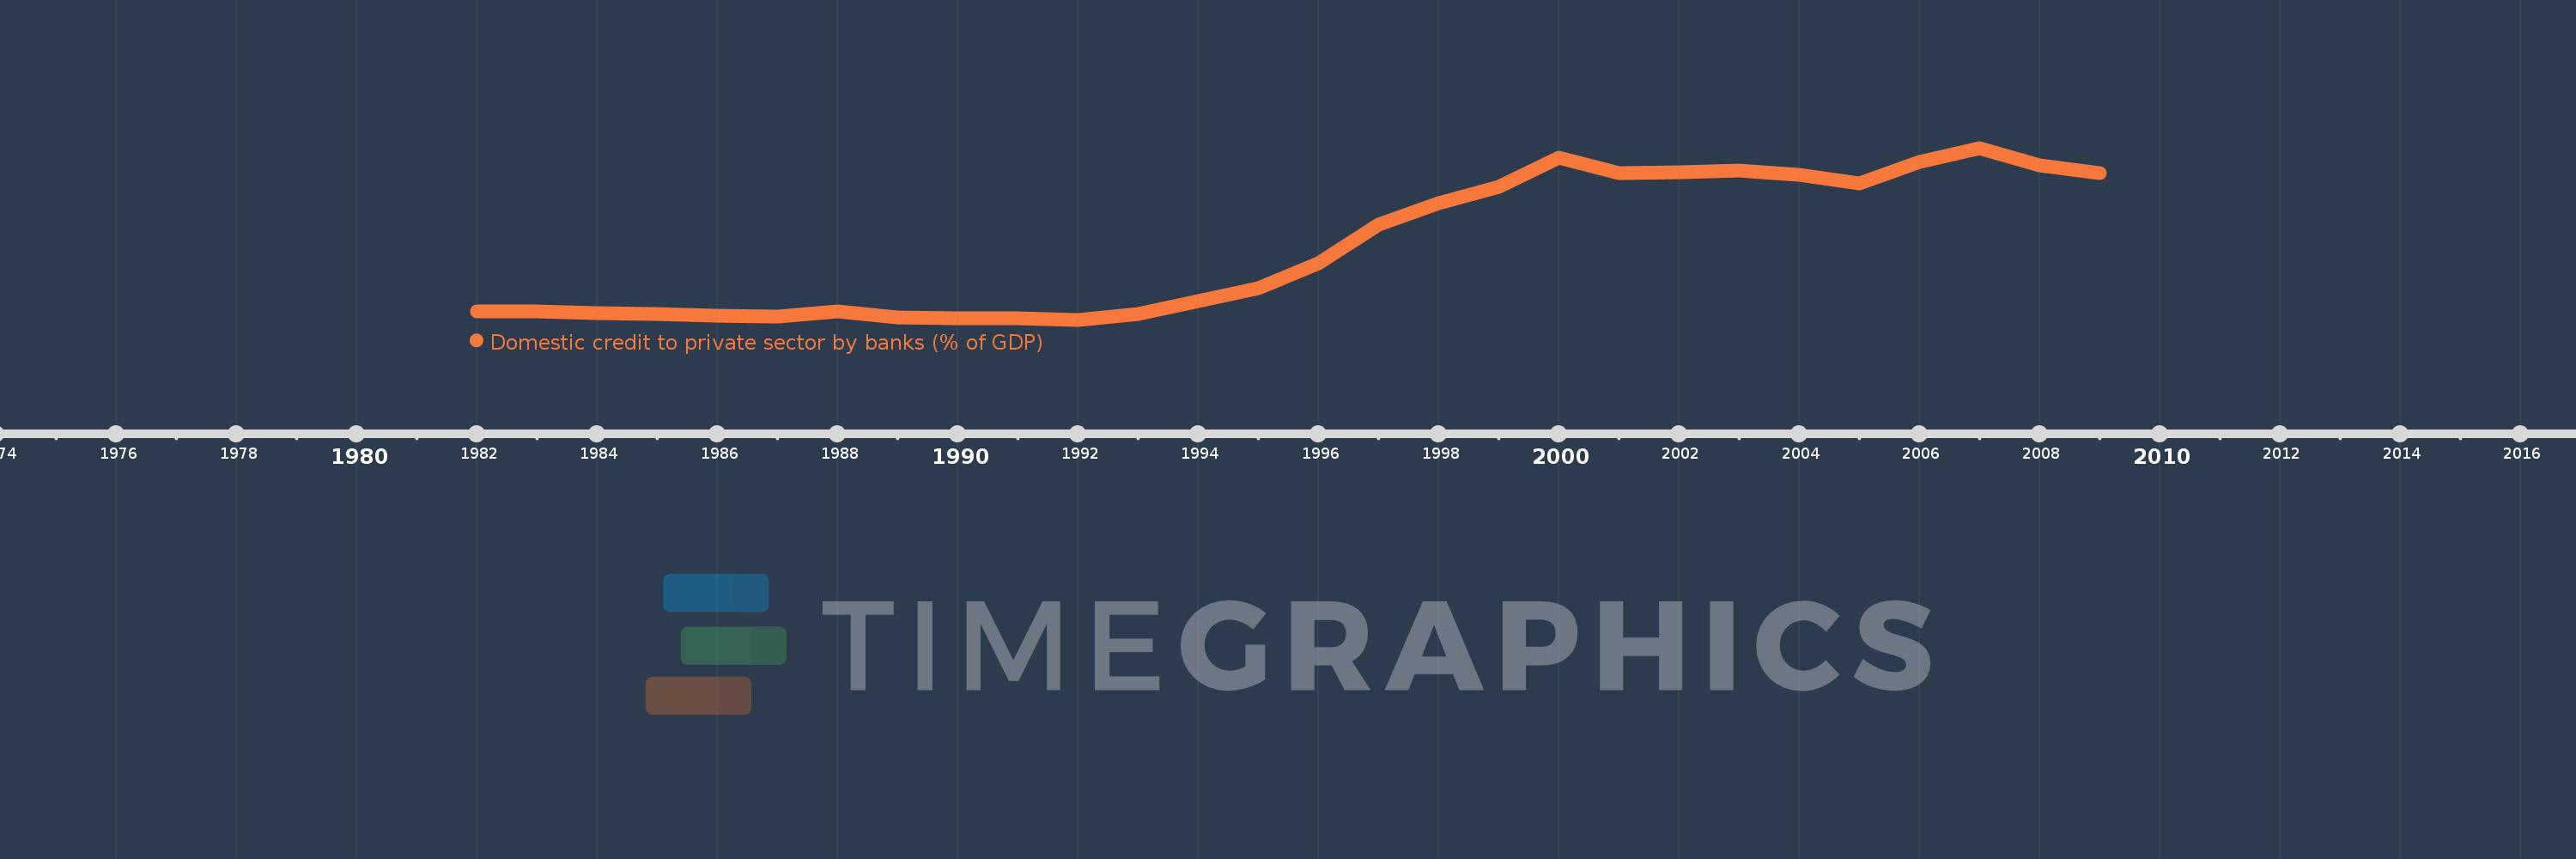
Domestic credit to private sector by banks (% of GDP)
2009,2008,2007,2006,2005,2004,2003,2002,2001,2000,1999,1998,1997,1996,1995,1994,1993,1992,1991,1990,1989,1988,1987,1986,1985,1984,1983,1982
Estas estadísticas en otros países:
AfghanistanAlbaniaAlgeriaAngolaAntigua and BarbudaArab WorldArgentinaArmeniaArubaAustraliaAustriaAzerbaijanBahamas, TheBahrainBangladeshBarbadosBelarusBelgiumBelizeBeninBhutanBoliviaBosnia and HerzegovinaBotswanaBrazilBrunei DarussalamBulgariaBurkina FasoBurundiCabo VerdeCambodiaCameroonCanadaCaribbean small statesCentral African RepublicCentral Europe and the BalticsChadChileChinaColombiaComorosCongo, Dem. Rep.Congo, Rep.Costa RicaCote d'IvoireCroatiaCyprusCzech RepublicDenmarkDjiboutiDominicaDominican RepublicEarly-demographic dividendEast Asia & PacificEast Asia & Pacific (excluding high income)East Asia & Pacific (IDA & IBRD countries)EcuadorEgypt, Arab Rep.El SalvadorEquatorial GuineaEritreaEstoniaEthiopiaEuro areaEurope & Central AsiaEurope & Central Asia (excluding high income)Europe & Central Asia (IDA & IBRD countries)European UnionFijiFinlandFragile and conflict affected situationsFranceGabonGambia, TheGeorgiaGermanyGhanaGreeceGrenadaGuatemalaGuineaGuinea-BissauGuyanaHaitiHeavily indebted poor countries (HIPC)High incomeHondurasHong Kong SAR, ChinaHungaryIBRD onlyIcelandIDA & IBRD totalIDA blendIDA onlyIDA totalIndiaIndonesiaIran, Islamic Rep.IraqIrelandIsraelItalyJamaicaJapanJordanKazakhstanKenyaKorea, Rep.KosovoKuwaitKyrgyz RepublicLao PDRLate-demographic dividendLatin America & Caribbean Latin America & Caribbean (excluding high income)Latin America & the Caribbean (IDA & IBRD countries)LatviaLeast developed countries: UN classificationLebanonLesothoLiberiaLibyaLithuaniaLow & middle incomeLow incomeLower middle incomeLuxembourgMacao SAR, ChinaMacedonia, FYRMadagascarMalawiMalaysiaMaldivesMaliMaltaMauritaniaMauritiusMexicoMicronesia, Fed. Sts.Middle East & North AfricaMiddle East & North Africa (excluding high income)Middle East & North Africa (IDA & IBRD countries)Middle incomeMoldovaMongoliaMontenegroMoroccoMozambiqueMyanmarNamibiaNepalNetherlandsNew ZealandNicaraguaNigerNigeriaNorth AmericaNorwayOECD membersOmanOther small statesPacific island small statesPakistanPanamaPapua New GuineaParaguayPeruPhilippinesPolandPortugalPost-demographic dividendPre-demographic dividendQatarRomaniaRussian FederationRwandaSamoaSao Tome and PrincipeSaudi ArabiaSenegalSerbiaSeychellesSierra LeoneSingaporeSlovak RepublicSloveniaSmall statesSolomon IslandsSouth AfricaSouth AsiaSouth Asia (IDA & IBRD)South SudanSpainSri LankaSt. Kitts and NevisSt. LuciaSt. Vincent and the GrenadinesSub-Saharan Africa Sub-Saharan Africa (excluding high income)Sub-Saharan Africa (IDA & IBRD countries)SudanSurinameSwazilandSwedenSwitzerlandSyrian Arab RepublicTajikistanTanzaniaThailandTimor-LesteTogoTongaTrinidad and TobagoTunisiaTurkeyUgandaUkraineUnited Arab EmiratesUnited KingdomUnited StatesUpper middle incomeUruguayVanuatuVenezuela, RBVietnamWest Bank and GazaWorldYemen, Rep.ZambiaZimbabwe línea de tiempo (timeline):
En esta escala de tiempo se presenta un gráfico de 1982 y 2009 de Ethiopia. Los datos de 1981 están ausentes. El número de observaciones reales por fecha: 28.
Fuente (nombre):
Indicadores del desarrollo mundial
Fuente (organización):
International Monetary Fund, International Financial Statistics and data files, and World Bank and OECD GDP estimates.
Categorías:
Financial Sector
Se ha actualizado:
23 abr 2017 año
Los indicadores de los cambios de valor en los últimos años
Mínimo:
1.474
1 ene 1992 año
Máximo:
20.446
1 ene 2007 año
A la fecha de observación
Valor
Cambio absoluto
El cambio con respecto al valor anterior
1 ene 1982 año
2.433
+2.433
0.0%
1 ene 1983 año
2.422
-0.011
-0.45%
1 ene 1984 año
2.18
-0.243
-10.02%
1 ene 1985 año
2.154
-0.025
-1.15%
1 ene 1986 año
1.903
-0.251
-11.65%
1 ene 1987 año
1.84
-0.063
-3.32%
1 ene 1988 año
2.368
+0.527
28.65%
1 ene 1989 año
1.707
-0.66
-27.89%
1 ene 1990 año
1.639
-0.068
-4.0%
1 ene 1991 año
1.622
-0.017
-1.06%
1 ene 1992 año
1.474
-0.147
-9.08%
1 ene 1993 año
2.123
+0.649
44.01%
1 ene 1994 año
3.578
+1.455
68.51%
1 ene 1995 año
4.962
+1.384
38.68%
1 ene 1996 año
7.733
+2.771
55.85%
1 ene 1997 año
11.94
+4.207
54.4%
1 ene 1998 año
14.345
+2.405
20.15%
1 ene 1999 año
16.158
+1.812
12.63%
1 ene 2000 año
19.392
+3.234
20.02%
1 ene 2001 año
17.624
-1.768
-9.12%
1 ene 2002 año
17.779
+0.155
0.88%
1 ene 2003 año
17.978
+0.2
1.12%
1 ene 2004 año
17.496
-0.483
-2.68%
1 ene 2005 año
16.527
-0.968
-5.53%
1 ene 2006 año
18.86
+2.332
14.11%
1 ene 2007 año
20.446
+1.587
8.41%
1 ene 2008 año
18.522
-1.924
-9.41%
1 ene 2009 año
17.645
-0.878
-4.74%
Ranking de los países por los datos estadísticos actuales


Comentarios: