29
/es/
es
AIzaSyAYiBZKx7MnpbEhh9jyipgxe19OcubqV5w
April 1, 2024
285757
Zambia
ZMB
true
2
1
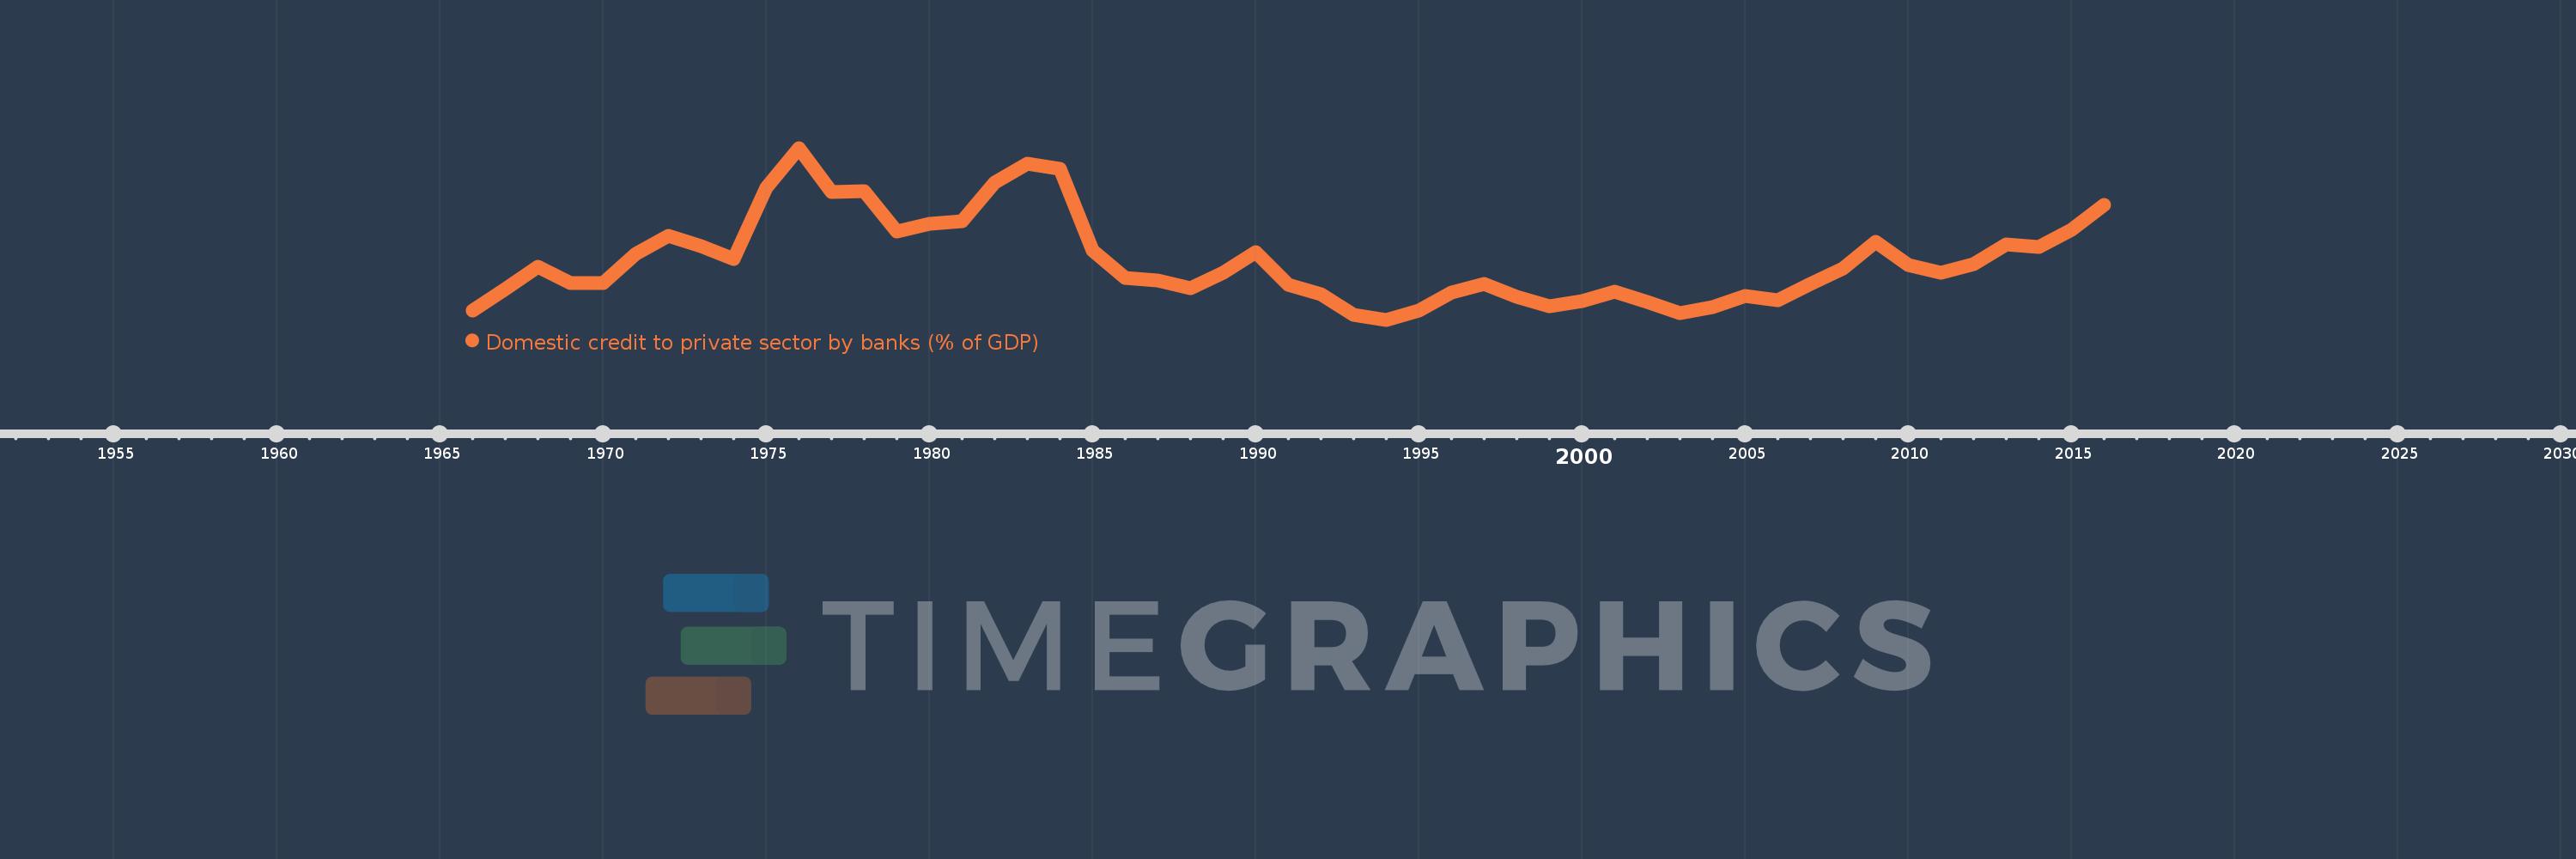
Domestic credit to private sector by banks (% of GDP)
2016,2015,2014,2013,2012,2011,2010,2009,2008,2007,2006,2005,2004,2003,2002,2001,2000,1999,1998,1997,1996,1995,1994,1993,1992,1991,1990,1989,1988,1987,1986,1985,1984,1983,1982,1981,1980,1979,1978,1977,1976,1975,1974,1973,1972,1971,1970,1969,1968,1967,1966
Estas estadísticas en otros países:
AfghanistanAlbaniaAlgeriaAngolaAntigua and BarbudaArab WorldArgentinaArmeniaArubaAustraliaAustriaAzerbaijanBahamas, TheBahrainBangladeshBarbadosBelarusBelgiumBelizeBeninBhutanBoliviaBosnia and HerzegovinaBotswanaBrazilBrunei DarussalamBulgariaBurkina FasoBurundiCabo VerdeCambodiaCameroonCanadaCaribbean small statesCentral African RepublicCentral Europe and the BalticsChadChileChinaColombiaComorosCongo, Dem. Rep.Congo, Rep.Costa RicaCote d'IvoireCroatiaCyprusCzech RepublicDenmarkDjiboutiDominicaDominican RepublicEarly-demographic dividendEast Asia & PacificEast Asia & Pacific (excluding high income)East Asia & Pacific (IDA & IBRD countries)EcuadorEgypt, Arab Rep.El SalvadorEquatorial GuineaEritreaEstoniaEthiopiaEuro areaEurope & Central AsiaEurope & Central Asia (excluding high income)Europe & Central Asia (IDA & IBRD countries)European UnionFijiFinlandFragile and conflict affected situationsFranceGabonGambia, TheGeorgiaGermanyGhanaGreeceGrenadaGuatemalaGuineaGuinea-BissauGuyanaHaitiHeavily indebted poor countries (HIPC)High incomeHondurasHong Kong SAR, ChinaHungaryIBRD onlyIcelandIDA & IBRD totalIDA blendIDA onlyIDA totalIndiaIndonesiaIran, Islamic Rep.IraqIrelandIsraelItalyJamaicaJapanJordanKazakhstanKenyaKorea, Rep.KosovoKuwaitKyrgyz RepublicLao PDRLate-demographic dividendLatin America & Caribbean Latin America & Caribbean (excluding high income)Latin America & the Caribbean (IDA & IBRD countries)LatviaLeast developed countries: UN classificationLebanonLesothoLiberiaLibyaLithuaniaLow & middle incomeLow incomeLower middle incomeLuxembourgMacao SAR, ChinaMacedonia, FYRMadagascarMalawiMalaysiaMaldivesMaliMaltaMauritaniaMauritiusMexicoMicronesia, Fed. Sts.Middle East & North AfricaMiddle East & North Africa (excluding high income)Middle East & North Africa (IDA & IBRD countries)Middle incomeMoldovaMongoliaMontenegroMoroccoMozambiqueMyanmarNamibiaNepalNetherlandsNew ZealandNicaraguaNigerNigeriaNorth AmericaNorwayOECD membersOmanOther small statesPacific island small statesPakistanPanamaPapua New GuineaParaguayPeruPhilippinesPolandPortugalPost-demographic dividendPre-demographic dividendQatarRomaniaRussian FederationRwandaSamoaSao Tome and PrincipeSaudi ArabiaSenegalSerbiaSeychellesSierra LeoneSingaporeSlovak RepublicSloveniaSmall statesSolomon IslandsSouth AfricaSouth AsiaSouth Asia (IDA & IBRD)South SudanSpainSri LankaSt. Kitts and NevisSt. LuciaSt. Vincent and the GrenadinesSub-Saharan Africa Sub-Saharan Africa (excluding high income)Sub-Saharan Africa (IDA & IBRD countries)SudanSurinameSwazilandSwedenSwitzerlandSyrian Arab RepublicTajikistanTanzaniaThailandTimor-LesteTogoTongaTrinidad and TobagoTunisiaTurkeyUgandaUkraineUnited Arab EmiratesUnited KingdomUnited StatesUpper middle incomeUruguayVanuatuVenezuela, RBVietnamWest Bank and GazaWorldYemen, Rep.ZambiaZimbabwe línea de tiempo (timeline):
En esta escala de tiempo se presenta un gráfico de 1966 y 2016 de Zambia. Los datos de 1965 están ausentes. El número de observaciones reales por fecha: 51.
Fuente (nombre):
Indicadores del desarrollo mundial
Fuente (organización):
International Monetary Fund, International Financial Statistics and data files, and World Bank and OECD GDP estimates.
Categorías:
Financial Sector
Se ha actualizado:
23 abr 2017 año
Los indicadores de los cambios de valor en los últimos años
Mínimo:
4.646
1 ene 1994 año
Máximo:
21.198
1 ene 1976 año
A la fecha de observación
Valor
Cambio absoluto
El cambio con respecto al valor anterior
1 ene 1966 año
5.567
+5.567
0.0%
1 ene 1967 año
7.608
+2.041
36.65%
1 ene 1968 año
9.72
+2.112
27.76%
1 ene 1969 año
8.194
-1.526
-15.7%
1 ene 1970 año
8.158
-0.036
-0.44%
1 ene 1971 año
11.029
+2.871
35.2%
1 ene 1972 año
12.724
+1.695
15.37%
1 ene 1973 año
11.741
-0.984
-7.73%
1 ene 1974 año
10.528
-1.212
-10.33%
1 ene 1975 año
17.386
+6.857
65.13%
1 ene 1976 año
21.198
+3.813
21.93%
1 ene 1977 año
16.939
-4.26
-20.09%
1 ene 1978 año
17.005
+0.066
0.39%
1 ene 1979 año
13.112
-3.892
-22.89%
1 ene 1980 año
13.929
+0.817
6.23%
1 ene 1981 año
14.147
+0.218
1.56%
1 ene 1982 año
17.881
+3.734
26.39%
1 ene 1983 año
19.716
+1.835
10.26%
1 ene 1984 año
19.191
-0.525
-2.66%
1 ene 1985 año
11.285
-7.906
-41.2%
1 ene 1986 año
8.667
-2.618
-23.2%
1 ene 1987 año
8.464
-0.203
-2.34%
1 ene 1988 año
7.647
-0.817
-9.65%
1 ene 1989 año
9.202
+1.555
20.34%
1 ene 1990 año
11.184
+1.982
21.54%
1 ene 1991 año
8.045
-3.14
-28.07%
1 ene 1992 año
7.087
-0.958
-11.91%
1 ene 1993 año
5.125
-1.962
-27.68%
1 ene 1994 año
4.646
-0.479
-9.35%
1 ene 1995 año
5.557
+0.912
19.62%
1 ene 1996 año
7.296
+1.739
31.28%
1 ene 1997 año
8.061
+0.765
10.48%
1 ene 1998 año
6.825
-1.236
-15.33%
1 ene 1999 año
5.962
-0.863
-12.64%
1 ene 2000 año
6.422
+0.46
7.71%
1 ene 2001 año
7.37
+0.949
14.77%
1 ene 2002 año
6.36
-1.01
-13.71%
1 ene 2003 año
5.299
-1.061
-16.69%
1 ene 2004 año
5.851
+0.552
10.42%
1 ene 2005 año
6.931
+1.081
18.47%
1 ene 2006 año
6.529
-0.402
-5.8%
1 ene 2007 año
8.08
+1.551
23.76%
1 ene 2008 año
9.625
+1.544
19.11%
1 ene 2009 año
12.173
+2.548
26.48%
1 ene 2010 año
9.953
-2.22
-18.24%
1 ene 2011 año
9.148
-0.805
-8.09%
1 ene 2012 año
10.012
+0.864
9.44%
1 ene 2013 año
11.933
+1.921
19.19%
1 ene 2014 año
11.642
-0.291
-2.44%
1 ene 2015 año
13.331
+1.689
14.51%
1 ene 2016 año
15.678
+2.347
17.61%
Ranking de los países por los datos estadísticos actuales


Comentarios: