29
/es/
es
AIzaSyAYiBZKx7MnpbEhh9jyipgxe19OcubqV5w
April 1, 2024
57927
South Asia (IDA & IBRD)
TSA
false
2
1
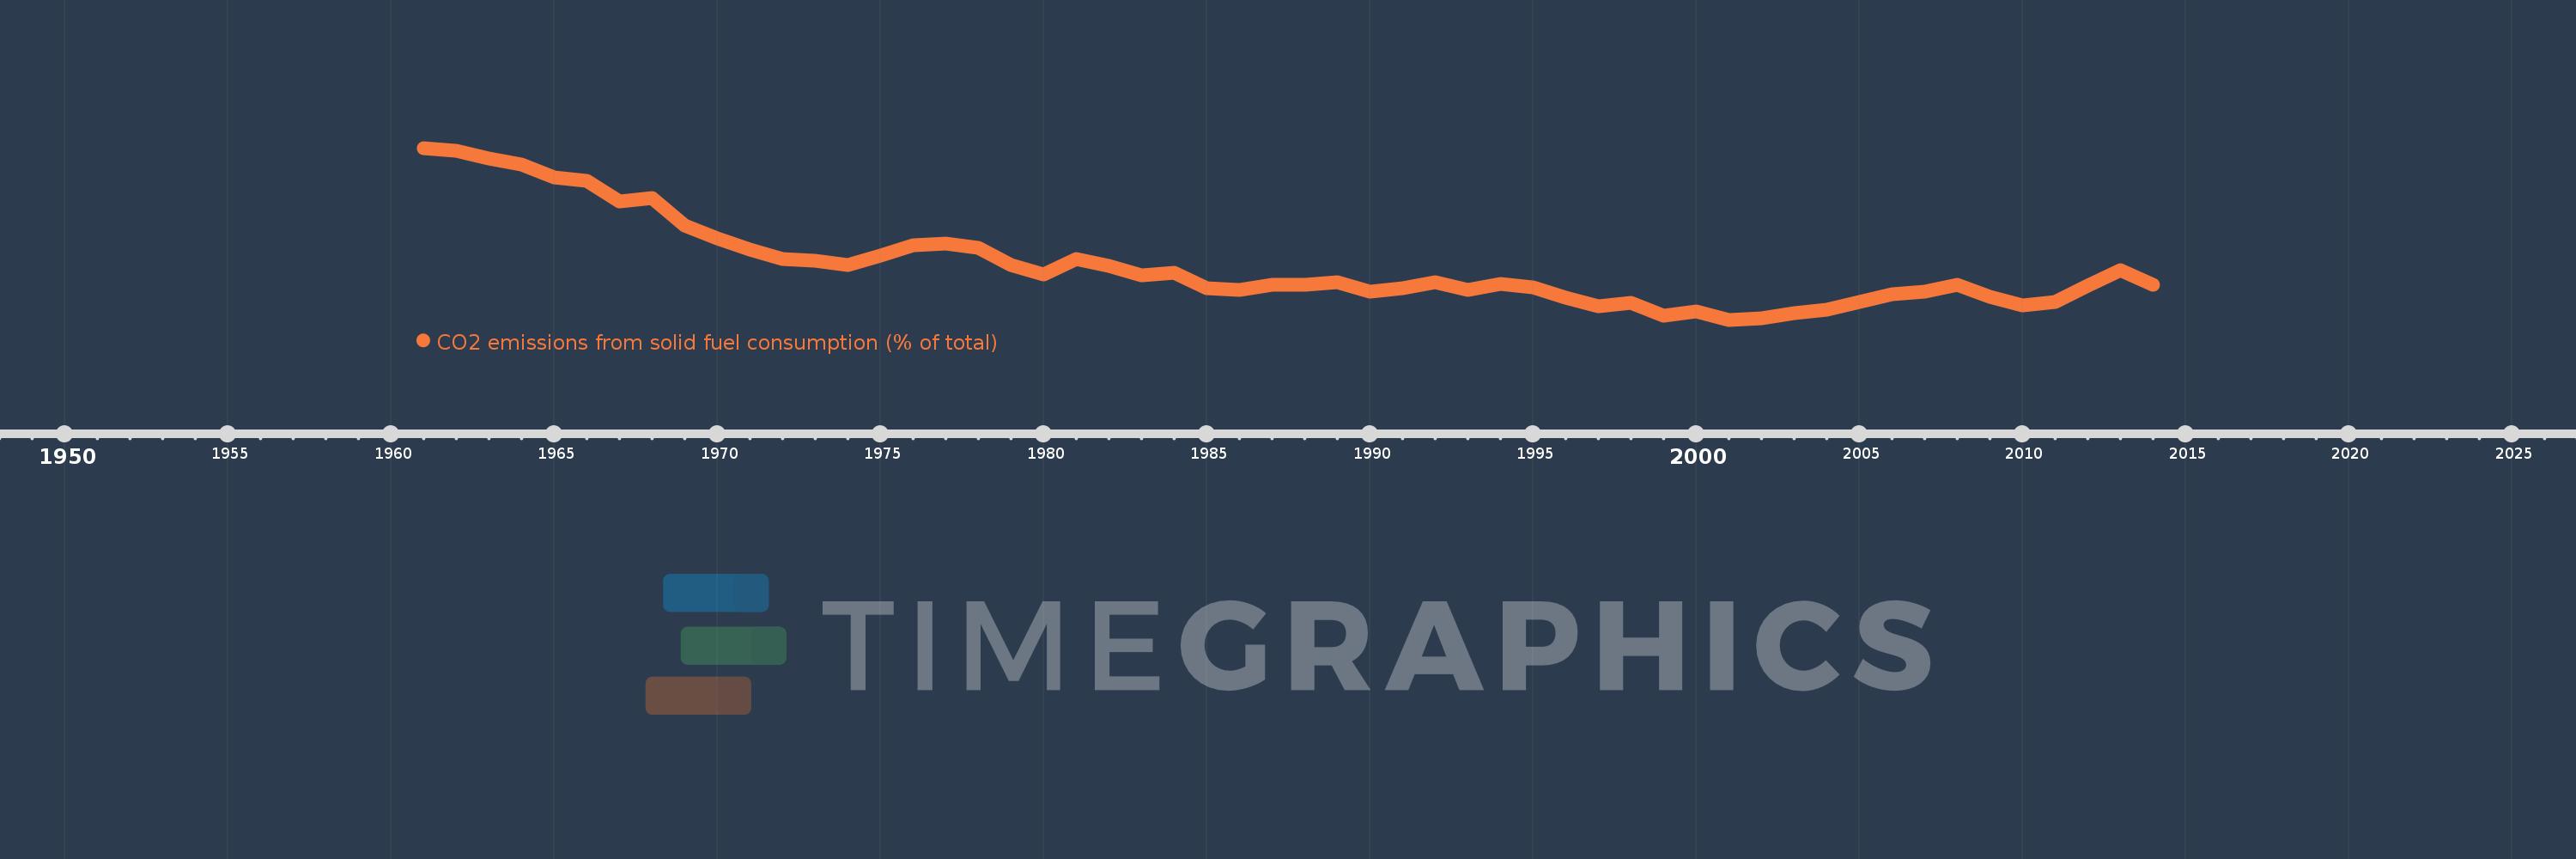
CO2 emissions from solid fuel consumption (% of total)
2014,2013,2012,2011,2010,2009,2008,2007,2006,2005,2004,2003,2002,2001,2000,1999,1998,1997,1996,1995,1994,1993,1992,1991,1990,1989,1988,1987,1986,1985,1984,1983,1982,1981,1980,1979,1978,1977,1976,1975,1974,1973,1972,1971,1970,1969,1968,1967,1966,1965,1964,1963,1962,1961
Estas estadísticas en otros países:
AfghanistanAlbaniaAlgeriaAndorraAngolaAntigua and BarbudaArab WorldArgentinaArmeniaArubaAustraliaAustriaAzerbaijanBahamas, TheBahrainBangladeshBarbadosBelarusBelgiumBelizeBeninBermudaBhutanBoliviaBosnia and HerzegovinaBotswanaBrazilBritish Virgin IslandsBrunei DarussalamBulgariaBurkina FasoBurundiCabo VerdeCambodiaCameroonCanadaCaribbean small statesCayman IslandsCentral African RepublicCentral Europe and the BalticsChadChileChinaColombiaComorosCongo, Dem. Rep.Congo, Rep.Costa RicaCote d'IvoireCroatiaCubaCuracaoCyprusCzech RepublicDenmarkDjiboutiDominicaDominican RepublicEarly-demographic dividendEast Asia & PacificEast Asia & Pacific (excluding high income)East Asia & Pacific (IDA & IBRD countries)EcuadorEgypt, Arab Rep.El SalvadorEquatorial GuineaEritreaEstoniaEthiopiaEuro areaEurope & Central AsiaEurope & Central Asia (excluding high income)Europe & Central Asia (IDA & IBRD countries)European UnionFaroe IslandsFijiFinlandFragile and conflict affected situationsFranceFrench PolynesiaGabonGambia, TheGeorgiaGermanyGhanaGibraltarGreeceGreenlandGrenadaGuatemalaGuineaGuinea-BissauGuyanaHaitiHeavily indebted poor countries (HIPC)High incomeHondurasHong Kong SAR, ChinaHungaryIBRD onlyIcelandIDA & IBRD totalIDA blendIDA onlyIDA totalIndiaIndonesiaIran, Islamic Rep.IraqIrelandIsraelItalyJamaicaJapanJordanKazakhstanKenyaKiribatiKorea, Dem. People’s Rep.Korea, Rep.KuwaitKyrgyz RepublicLao PDRLate-demographic dividendLatin America & Caribbean Latin America & Caribbean (excluding high income)Latin America & the Caribbean (IDA & IBRD countries)LatviaLeast developed countries: UN classificationLebanonLesothoLiberiaLibyaLiechtensteinLithuaniaLow & middle incomeLow incomeLower middle incomeLuxembourgMacao SAR, ChinaMacedonia, FYRMadagascarMalawiMalaysiaMaldivesMaliMaltaMarshall IslandsMauritaniaMauritiusMexicoMicronesia, Fed. Sts.Middle East & North AfricaMiddle East & North Africa (excluding high income)Middle East & North Africa (IDA & IBRD countries)Middle incomeMoldovaMongoliaMontenegroMoroccoMozambiqueMyanmarNamibiaNauruNepalNetherlandsNew CaledoniaNew ZealandNicaraguaNigerNigeriaNorth AmericaNorwayOECD membersOmanOther small statesPacific island small statesPakistanPalauPanamaPapua New GuineaParaguayPeruPhilippinesPolandPortugalPost-demographic dividendPre-demographic dividendQatarRomaniaRussian FederationRwandaSamoaSao Tome and PrincipeSaudi ArabiaSenegalSerbiaSeychellesSierra LeoneSingaporeSint Maarten (Dutch part)Slovak RepublicSloveniaSmall statesSolomon IslandsSomaliaSouth AfricaSouth AsiaSouth Asia (IDA & IBRD)South SudanSpainSri LankaSt. Kitts and NevisSt. LuciaSt. Vincent and the GrenadinesSub-Saharan Africa Sub-Saharan Africa (excluding high income)Sub-Saharan Africa (IDA & IBRD countries)SudanSurinameSwazilandSwedenSwitzerlandSyrian Arab RepublicTajikistanTanzaniaThailandTimor-LesteTogoTongaTrinidad and TobagoTunisiaTurkeyTurkmenistanTurks and Caicos IslandsUgandaUkraineUnited Arab EmiratesUnited KingdomUnited StatesUpper middle incomeUruguayUzbekistanVanuatuVenezuela, RBVietnamWest Bank and GazaWorldYemen, Rep.ZambiaZimbabwe línea de tiempo (timeline):
En esta escala de tiempo se presenta un gráfico de 1961 y 2014 de South Asia (IDA & IBRD). Los datos de 1960 están ausentes. El número de observaciones reales por fecha: 54.
Fuente (nombre):
Indicadores del desarrollo mundial
Fuente (organización):
Carbon Dioxide Information Analysis Center, Environmental Sciences Division, Oak Ridge National Laboratory, Tennessee, United States.
Categorías:
Climate Change, Environment
Se ha actualizado:
23 abr 2017 año
Los indicadores de los cambios de valor en los últimos años
Mínimo:
54.552
1 ene 2001 año
Máximo:
75.583
1 ene 1961 año
A la fecha de observación
Valor
Cambio absoluto
El cambio con respecto al valor anterior
1 ene 1961 año
75.583
+75.583
0.0%
1 ene 1962 año
75.227
-0.355
-0.47%
1 ene 1963 año
74.329
-0.899
-1.19%
1 ene 1964 año
73.593
-0.736
-0.99%
1 ene 1965 año
71.98
-1.612
-2.19%
1 ene 1966 año
71.538
-0.442
-0.61%
1 ene 1967 año
69.009
-2.53
-3.54%
1 ene 1968 año
69.505
+0.497
0.72%
1 ene 1969 año
66.037
-3.468
-4.99%
1 ene 1970 año
64.521
-1.516
-2.3%
1 ene 1971 año
63.148
-1.374
-2.13%
1 ene 1972 año
61.983
-1.165
-1.84%
1 ene 1973 año
61.786
-0.197
-0.32%
1 ene 1974 año
61.202
-0.584
-0.94%
1 ene 1975 año
62.405
+1.203
1.97%
1 ene 1976 año
63.653
+1.248
2.0%
1 ene 1977 año
63.839
+0.185
0.29%
1 ene 1978 año
63.405
-0.434
-0.68%
1 ene 1979 año
61.223
-2.181
-3.44%
1 ene 1980 año
60.083
-1.14
-1.86%
1 ene 1981 año
61.961
+1.878
3.13%
1 ene 1982 año
61.169
-0.792
-1.28%
1 ene 1983 año
59.975
-1.194
-1.95%
1 ene 1984 año
60.26
+0.284
0.47%
1 ene 1985 año
58.457
-1.803
-2.99%
1 ene 1986 año
58.249
-0.208
-0.36%
1 ene 1987 año
58.783
+0.534
0.92%
1 ene 1988 año
58.785
+0.002
0.0%
1 ene 1989 año
59.154
+0.368
0.63%
1 ene 1990 año
58.028
-1.126
-1.9%
1 ene 1991 año
58.454
+0.426
0.73%
1 ene 1992 año
59.128
+0.673
1.15%
1 ene 1993 año
58.171
-0.957
-1.62%
1 ene 1994 año
58.989
+0.818
1.41%
1 ene 1995 año
58.557
-0.433
-0.73%
1 ene 1996 año
57.273
-1.283
-2.19%
1 ene 1997 año
56.215
-1.059
-1.85%
1 ene 1998 año
56.643
+0.429
0.76%
1 ene 1999 año
55.042
-1.601
-2.83%
1 ene 2000 año
55.524
+0.481
0.87%
1 ene 2001 año
54.552
-0.972
-1.75%
1 ene 2002 año
54.683
+0.131
0.24%
1 ene 2003 año
55.38
+0.697
1.28%
1 ene 2004 año
55.749
+0.369
0.67%
1 ene 2005 año
56.725
+0.976
1.75%
1 ene 2006 año
57.708
+0.983
1.73%
1 ene 2007 año
58.006
+0.297
0.52%
1 ene 2008 año
58.859
+0.853
1.47%
1 ene 2009 año
57.341
-1.518
-2.58%
1 ene 2010 año
56.275
-1.065
-1.86%
1 ene 2011 año
56.748
+0.473
0.84%
1 ene 2012 año
58.732
+1.984
3.5%
1 ene 2013 año
60.602
+1.87
3.18%
1 ene 2014 año
58.806
-1.796
-2.96%
Ranking de los países por los datos estadísticos actuales


Comentarios: