29
/es/
es
AIzaSyAYiBZKx7MnpbEhh9jyipgxe19OcubqV5w
April 1, 2024
159221
Ireland
IRL
true
2
1
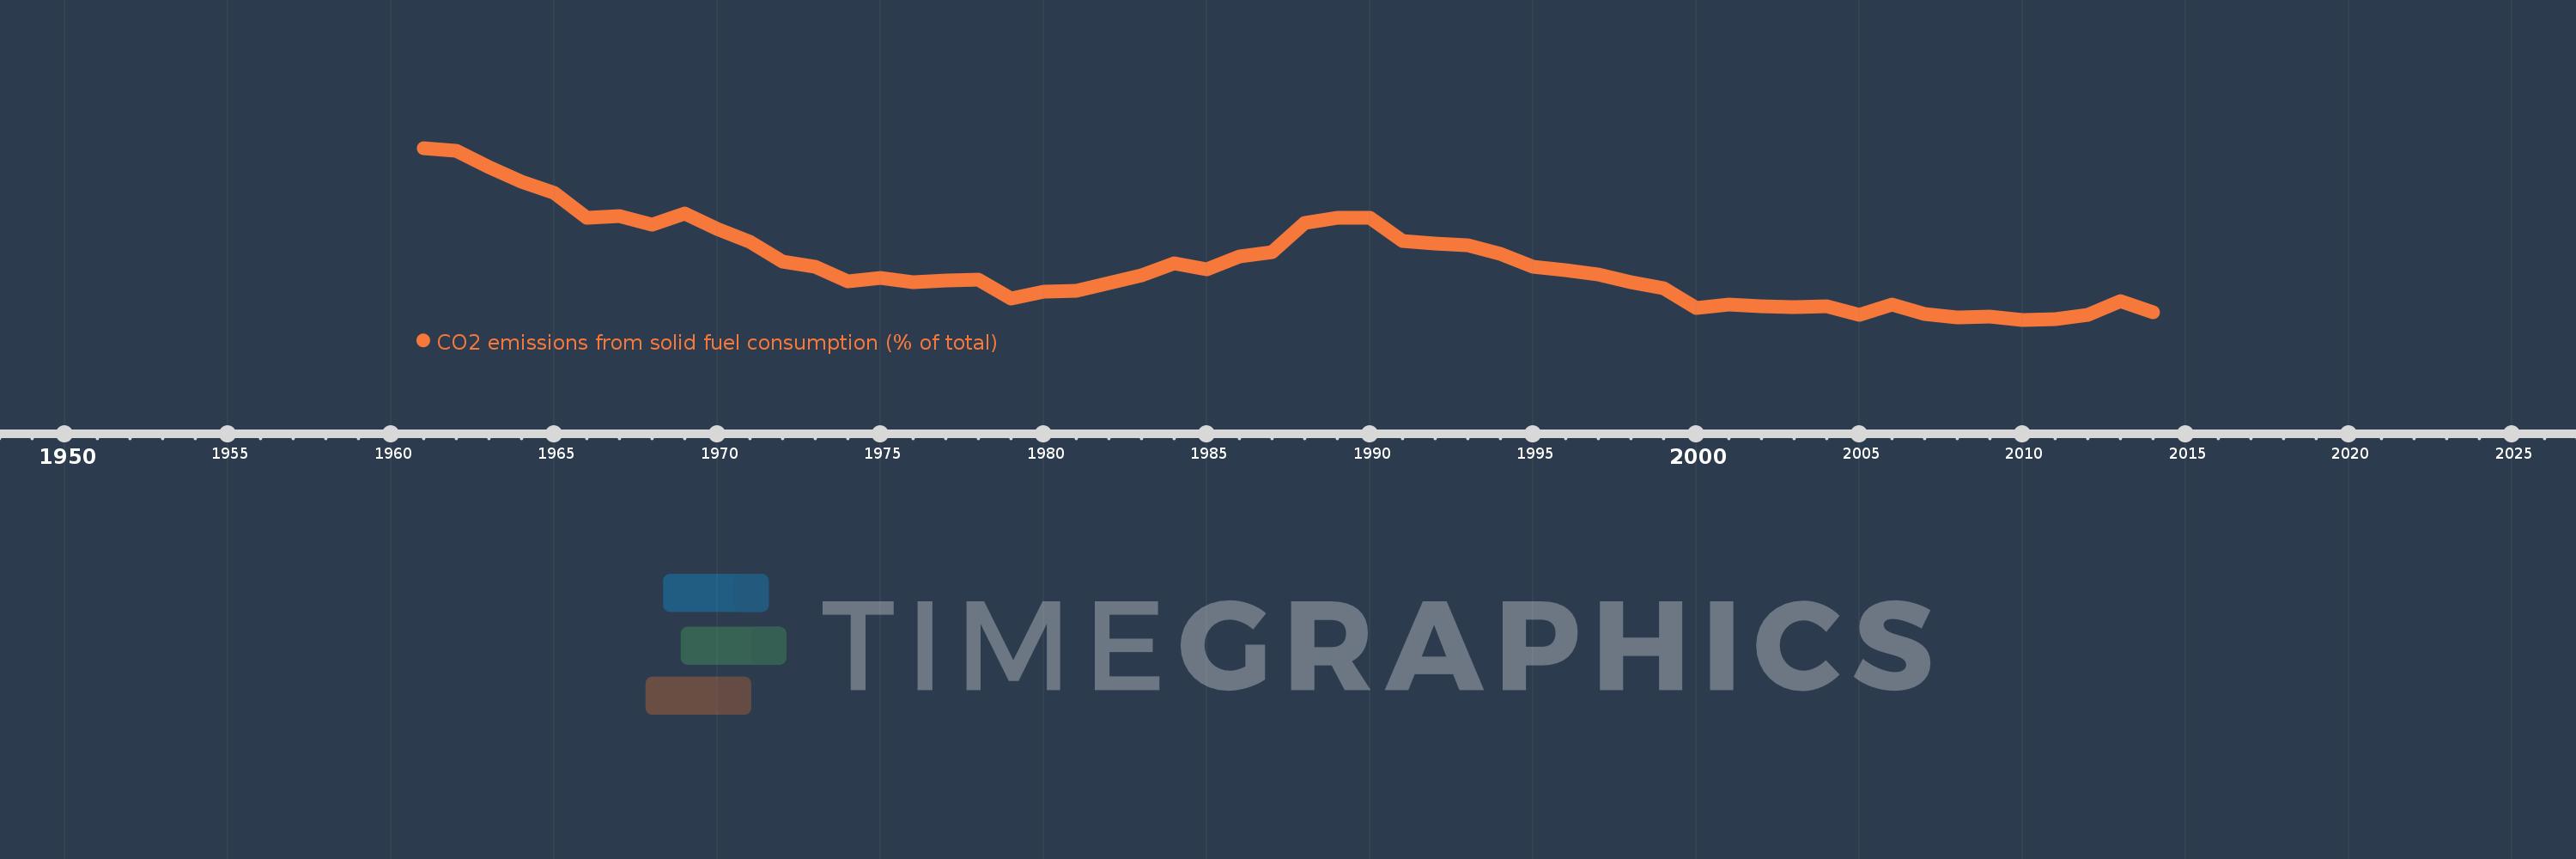
CO2 emissions from solid fuel consumption (% of total)
2014,2013,2012,2011,2010,2009,2008,2007,2006,2005,2004,2003,2002,2001,2000,1999,1998,1997,1996,1995,1994,1993,1992,1991,1990,1989,1988,1987,1986,1985,1984,1983,1982,1981,1980,1979,1978,1977,1976,1975,1974,1973,1972,1971,1970,1969,1968,1967,1966,1965,1964,1963,1962,1961
Estas estadísticas en otros países:
AfghanistanAlbaniaAlgeriaAndorraAngolaAntigua and BarbudaArab WorldArgentinaArmeniaArubaAustraliaAustriaAzerbaijanBahamas, TheBahrainBangladeshBarbadosBelarusBelgiumBelizeBeninBermudaBhutanBoliviaBosnia and HerzegovinaBotswanaBrazilBritish Virgin IslandsBrunei DarussalamBulgariaBurkina FasoBurundiCabo VerdeCambodiaCameroonCanadaCaribbean small statesCayman IslandsCentral African RepublicCentral Europe and the BalticsChadChileChinaColombiaComorosCongo, Dem. Rep.Congo, Rep.Costa RicaCote d'IvoireCroatiaCubaCuracaoCyprusCzech RepublicDenmarkDjiboutiDominicaDominican RepublicEarly-demographic dividendEast Asia & PacificEast Asia & Pacific (excluding high income)East Asia & Pacific (IDA & IBRD countries)EcuadorEgypt, Arab Rep.El SalvadorEquatorial GuineaEritreaEstoniaEthiopiaEuro areaEurope & Central AsiaEurope & Central Asia (excluding high income)Europe & Central Asia (IDA & IBRD countries)European UnionFaroe IslandsFijiFinlandFragile and conflict affected situationsFranceFrench PolynesiaGabonGambia, TheGeorgiaGermanyGhanaGibraltarGreeceGreenlandGrenadaGuatemalaGuineaGuinea-BissauGuyanaHaitiHeavily indebted poor countries (HIPC)High incomeHondurasHong Kong SAR, ChinaHungaryIBRD onlyIcelandIDA & IBRD totalIDA blendIDA onlyIDA totalIndiaIndonesiaIran, Islamic Rep.IraqIrelandIsraelItalyJamaicaJapanJordanKazakhstanKenyaKiribatiKorea, Dem. People’s Rep.Korea, Rep.KuwaitKyrgyz RepublicLao PDRLate-demographic dividendLatin America & Caribbean Latin America & Caribbean (excluding high income)Latin America & the Caribbean (IDA & IBRD countries)LatviaLeast developed countries: UN classificationLebanonLesothoLiberiaLibyaLiechtensteinLithuaniaLow & middle incomeLow incomeLower middle incomeLuxembourgMacao SAR, ChinaMacedonia, FYRMadagascarMalawiMalaysiaMaldivesMaliMaltaMarshall IslandsMauritaniaMauritiusMexicoMicronesia, Fed. Sts.Middle East & North AfricaMiddle East & North Africa (excluding high income)Middle East & North Africa (IDA & IBRD countries)Middle incomeMoldovaMongoliaMontenegroMoroccoMozambiqueMyanmarNamibiaNauruNepalNetherlandsNew CaledoniaNew ZealandNicaraguaNigerNigeriaNorth AmericaNorwayOECD membersOmanOther small statesPacific island small statesPakistanPalauPanamaPapua New GuineaParaguayPeruPhilippinesPolandPortugalPost-demographic dividendPre-demographic dividendQatarRomaniaRussian FederationRwandaSamoaSao Tome and PrincipeSaudi ArabiaSenegalSerbiaSeychellesSierra LeoneSingaporeSint Maarten (Dutch part)Slovak RepublicSloveniaSmall statesSolomon IslandsSomaliaSouth AfricaSouth AsiaSouth Asia (IDA & IBRD)South SudanSpainSri LankaSt. Kitts and NevisSt. LuciaSt. Vincent and the GrenadinesSub-Saharan Africa Sub-Saharan Africa (excluding high income)Sub-Saharan Africa (IDA & IBRD countries)SudanSurinameSwazilandSwedenSwitzerlandSyrian Arab RepublicTajikistanTanzaniaThailandTimor-LesteTogoTongaTrinidad and TobagoTunisiaTurkeyTurkmenistanTurks and Caicos IslandsUgandaUkraineUnited Arab EmiratesUnited KingdomUnited StatesUpper middle incomeUruguayUzbekistanVanuatuVenezuela, RBVietnamWest Bank and GazaWorldYemen, Rep.ZambiaZimbabwe línea de tiempo (timeline):
En esta escala de tiempo se presenta un gráfico de 1961 y 2014 de Ireland. Los datos de 1960 están ausentes. El número de observaciones reales por fecha: 54.
Fuente (nombre):
Indicadores del desarrollo mundial
Fuente (organización):
Carbon Dioxide Information Analysis Center, Environmental Sciences Division, Oak Ridge National Laboratory, Tennessee, United States.
Categorías:
Climate Change, Environment
Se ha actualizado:
23 abr 2017 año
Los indicadores de los cambios de valor en los últimos años
Mínimo:
20.325
1 ene 2010 año
Máximo:
67.99
1 ene 1961 año
A la fecha de observación
Valor
Cambio absoluto
El cambio con respecto al valor anterior
1 ene 1961 año
67.99
+67.99
0.0%
1 ene 1962 año
67.23
-0.759
-1.12%
1 ene 1963 año
62.772
-4.458
-6.63%
1 ene 1964 año
58.54
-4.233
-6.74%
1 ene 1965 año
55.424
-3.116
-5.32%
1 ene 1966 año
48.545
-6.879
-12.41%
1 ene 1967 año
49.139
+0.594
1.22%
1 ene 1968 año
46.604
-2.534
-5.16%
1 ene 1969 año
49.774
+3.17
6.8%
1 ene 1970 año
45.435
-4.339
-8.72%
1 ene 1971 año
42.01
-3.425
-7.54%
1 ene 1972 año
36.577
-5.433
-12.93%
1 ene 1973 año
35.002
-1.575
-4.31%
1 ene 1974 año
31.056
-3.946
-11.27%
1 ene 1975 año
31.975
+0.919
2.96%
1 ene 1976 año
30.778
-1.197
-3.74%
1 ene 1977 año
31.118
+0.34
1.11%
1 ene 1978 año
31.477
+0.358
1.15%
1 ene 1979 año
26.12
-5.356
-17.02%
1 ene 1980 año
28.17
+2.05
7.85%
1 ene 1981 año
28.24
+0.07
0.25%
1 ene 1982 año
30.418
+2.178
7.71%
1 ene 1983 año
32.726
+2.307
7.59%
1 ene 1984 año
35.886
+3.161
9.66%
1 ene 1985 año
34.286
-1.6
-4.46%
1 ene 1986 año
37.994
+3.708
10.81%
1 ene 1987 año
39.105
+1.111
2.92%
1 ene 1988 año
47.116
+8.011
20.48%
1 ene 1989 año
48.673
+1.557
3.3%
1 ene 1990 año
48.522
-0.151
-0.31%
1 ene 1991 año
42.183
-6.339
-13.06%
1 ene 1992 año
41.492
-0.691
-1.64%
1 ene 1993 año
41.014
-0.479
-1.15%
1 ene 1994 año
38.581
-2.433
-5.93%
1 ene 1995 año
35.028
-3.553
-9.21%
1 ene 1996 año
34.112
-0.916
-2.62%
1 ene 1997 año
32.871
-1.241
-3.64%
1 ene 1998 año
30.712
-2.159
-6.57%
1 ene 1999 año
28.961
-1.751
-5.7%
1 ene 2000 año
23.562
-5.4
-18.64%
1 ene 2001 año
24.531
+0.969
4.11%
1 ene 2002 año
24.078
-0.453
-1.85%
1 ene 2003 año
23.803
-0.275
-1.14%
1 ene 2004 año
24.122
+0.319
1.34%
1 ene 2005 año
21.611
-2.511
-10.41%
1 ene 2006 año
24.535
+2.924
13.53%
1 ene 2007 año
22.014
-2.521
-10.28%
1 ene 2008 año
20.923
-1.09
-4.95%
1 ene 2009 año
21.269
+0.346
1.65%
1 ene 2010 año
20.325
-0.944
-4.44%
1 ene 2011 año
20.567
+0.242
1.19%
1 ene 2012 año
21.668
+1.102
5.36%
1 ene 2013 año
25.613
+3.945
18.21%
1 ene 2014 año
22.37
-3.243
-12.66%
Ranking de los países por los datos estadísticos actuales


Comentarios: