29
/es/
es
AIzaSyAYiBZKx7MnpbEhh9jyipgxe19OcubqV5w
April 1, 2024
55382
Pre-demographic dividend
PRE
false
2
1
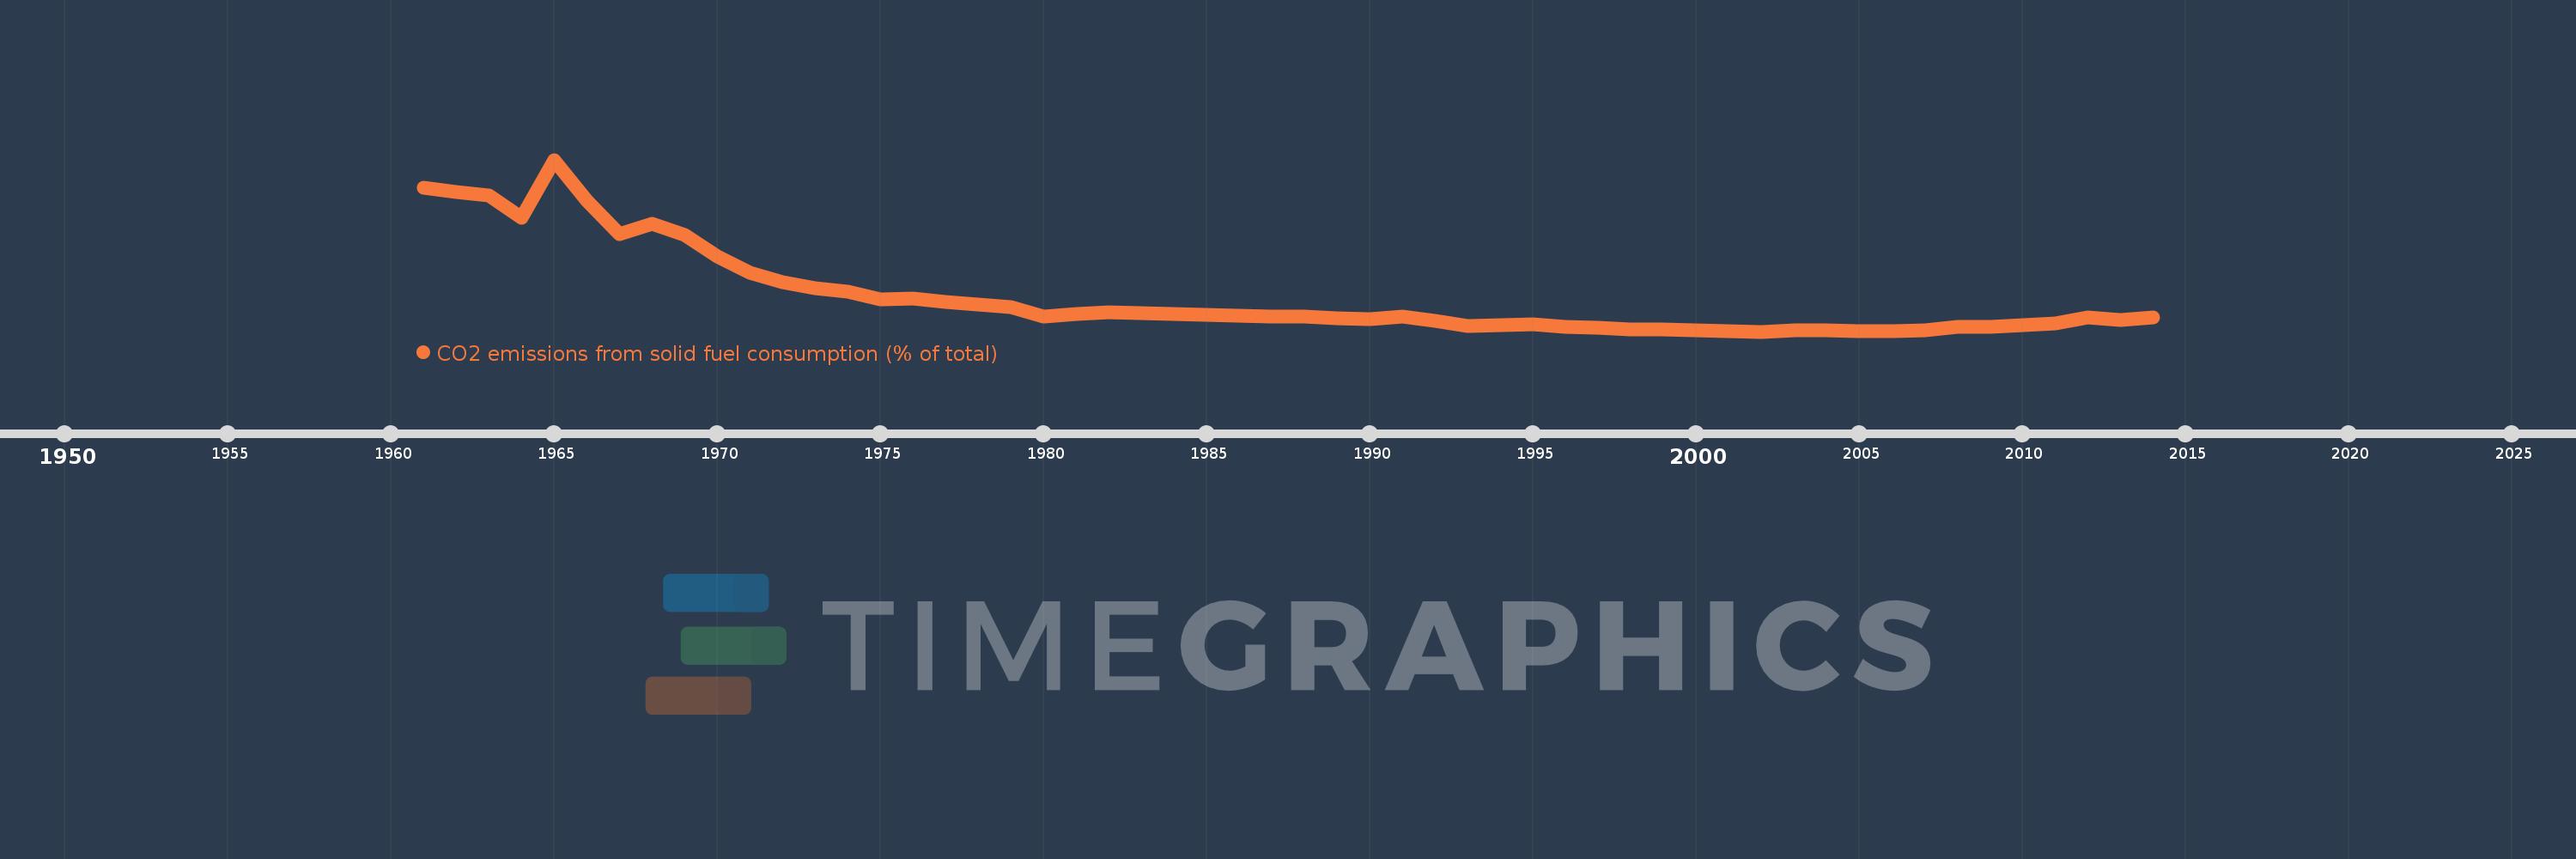
CO2 emissions from solid fuel consumption (% of total)
2014,2013,2012,2011,2010,2009,2008,2007,2006,2005,2004,2003,2002,2001,2000,1999,1998,1997,1996,1995,1994,1993,1992,1991,1990,1989,1988,1987,1986,1985,1984,1983,1982,1981,1980,1979,1978,1977,1976,1975,1974,1973,1972,1971,1970,1969,1968,1967,1966,1965,1964,1963,1962,1961
Estas estadísticas en otros países:
AfghanistanAlbaniaAlgeriaAndorraAngolaAntigua and BarbudaArab WorldArgentinaArmeniaArubaAustraliaAustriaAzerbaijanBahamas, TheBahrainBangladeshBarbadosBelarusBelgiumBelizeBeninBermudaBhutanBoliviaBosnia and HerzegovinaBotswanaBrazilBritish Virgin IslandsBrunei DarussalamBulgariaBurkina FasoBurundiCabo VerdeCambodiaCameroonCanadaCaribbean small statesCayman IslandsCentral African RepublicCentral Europe and the BalticsChadChileChinaColombiaComorosCongo, Dem. Rep.Congo, Rep.Costa RicaCote d'IvoireCroatiaCubaCuracaoCyprusCzech RepublicDenmarkDjiboutiDominicaDominican RepublicEarly-demographic dividendEast Asia & PacificEast Asia & Pacific (excluding high income)East Asia & Pacific (IDA & IBRD countries)EcuadorEgypt, Arab Rep.El SalvadorEquatorial GuineaEritreaEstoniaEthiopiaEuro areaEurope & Central AsiaEurope & Central Asia (excluding high income)Europe & Central Asia (IDA & IBRD countries)European UnionFaroe IslandsFijiFinlandFragile and conflict affected situationsFranceFrench PolynesiaGabonGambia, TheGeorgiaGermanyGhanaGibraltarGreeceGreenlandGrenadaGuatemalaGuineaGuinea-BissauGuyanaHaitiHeavily indebted poor countries (HIPC)High incomeHondurasHong Kong SAR, ChinaHungaryIBRD onlyIcelandIDA & IBRD totalIDA blendIDA onlyIDA totalIndiaIndonesiaIran, Islamic Rep.IraqIrelandIsraelItalyJamaicaJapanJordanKazakhstanKenyaKiribatiKorea, Dem. People’s Rep.Korea, Rep.KuwaitKyrgyz RepublicLao PDRLate-demographic dividendLatin America & Caribbean Latin America & Caribbean (excluding high income)Latin America & the Caribbean (IDA & IBRD countries)LatviaLeast developed countries: UN classificationLebanonLesothoLiberiaLibyaLiechtensteinLithuaniaLow & middle incomeLow incomeLower middle incomeLuxembourgMacao SAR, ChinaMacedonia, FYRMadagascarMalawiMalaysiaMaldivesMaliMaltaMarshall IslandsMauritaniaMauritiusMexicoMicronesia, Fed. Sts.Middle East & North AfricaMiddle East & North Africa (excluding high income)Middle East & North Africa (IDA & IBRD countries)Middle incomeMoldovaMongoliaMontenegroMoroccoMozambiqueMyanmarNamibiaNauruNepalNetherlandsNew CaledoniaNew ZealandNicaraguaNigerNigeriaNorth AmericaNorwayOECD membersOmanOther small statesPacific island small statesPakistanPalauPanamaPapua New GuineaParaguayPeruPhilippinesPolandPortugalPost-demographic dividendPre-demographic dividendQatarRomaniaRussian FederationRwandaSamoaSao Tome and PrincipeSaudi ArabiaSenegalSerbiaSeychellesSierra LeoneSingaporeSint Maarten (Dutch part)Slovak RepublicSloveniaSmall statesSolomon IslandsSomaliaSouth AfricaSouth AsiaSouth Asia (IDA & IBRD)South SudanSpainSri LankaSt. Kitts and NevisSt. LuciaSt. Vincent and the GrenadinesSub-Saharan Africa Sub-Saharan Africa (excluding high income)Sub-Saharan Africa (IDA & IBRD countries)SudanSurinameSwazilandSwedenSwitzerlandSyrian Arab RepublicTajikistanTanzaniaThailandTimor-LesteTogoTongaTrinidad and TobagoTunisiaTurkeyTurkmenistanTurks and Caicos IslandsUgandaUkraineUnited Arab EmiratesUnited KingdomUnited StatesUpper middle incomeUruguayUzbekistanVanuatuVenezuela, RBVietnamWest Bank and GazaWorldYemen, Rep.ZambiaZimbabwe línea de tiempo (timeline):
En esta escala de tiempo se presenta un gráfico de 1961 y 2014 de Pre-demographic dividend. Los datos de 1960 están ausentes. El número de observaciones reales por fecha: 54.
Fuente (nombre):
Indicadores del desarrollo mundial
Fuente (organización):
Carbon Dioxide Information Analysis Center, Environmental Sciences Division, Oak Ridge National Laboratory, Tennessee, United States.
Categorías:
Climate Change, Environment
Se ha actualizado:
23 abr 2017 año
Los indicadores de los cambios de valor en los últimos años
Mínimo:
0.486
1 ene 2002 año
Máximo:
19.636
1 ene 1965 año
A la fecha de observación
Valor
Cambio absoluto
El cambio con respecto al valor anterior
1 ene 1961 año
16.543
+16.543
0.0%
1 ene 1962 año
16.074
-0.468
-2.83%
1 ene 1963 año
15.69
-0.384
-2.39%
1 ene 1964 año
13.142
-2.548
-16.24%
1 ene 1965 año
19.636
+6.494
49.41%
1 ene 1966 año
15.095
-4.541
-23.13%
1 ene 1967 año
11.315
-3.779
-25.04%
1 ene 1968 año
12.472
+1.156
10.22%
1 ene 1969 año
11.229
-1.242
-9.96%
1 ene 1970 año
8.842
-2.387
-21.26%
1 ene 1971 año
7.063
-1.779
-20.12%
1 ene 1972 año
5.972
-1.091
-15.45%
1 ene 1973 año
5.288
-0.684
-11.45%
1 ene 1974 año
4.898
-0.39
-7.37%
1 ene 1975 año
4.11
-0.789
-16.1%
1 ene 1976 año
4.15
+0.041
1.0%
1 ene 1977 año
3.812
-0.339
-8.16%
1 ene 1978 año
3.51
-0.302
-7.93%
1 ene 1979 año
3.17
-0.34
-9.68%
1 ene 1980 año
2.164
-1.005
-31.71%
1 ene 1981 año
2.449
+0.285
13.15%
1 ene 1982 año
2.612
+0.163
6.66%
1 ene 1983 año
2.582
-0.03
-1.15%
1 ene 1984 año
2.424
-0.159
-6.14%
1 ene 1985 año
2.331
-0.093
-3.83%
1 ene 1986 año
2.231
-0.1
-4.27%
1 ene 1987 año
2.185
-0.047
-2.1%
1 ene 1988 año
2.125
-0.059
-2.71%
1 ene 1989 año
1.974
-0.152
-7.13%
1 ene 1990 año
1.854
-0.12
-6.06%
1 ene 1991 año
2.135
+0.281
15.15%
1 ene 1992 año
1.725
-0.41
-19.18%
1 ene 1993 año
1.153
-0.572
-33.17%
1 ene 1994 año
1.21
+0.057
4.95%
1 ene 1995 año
1.257
+0.046
3.83%
1 ene 1996 año
0.983
-0.274
-21.8%
1 ene 1997 año
0.957
-0.026
-2.62%
1 ene 1998 año
0.691
-0.266
-27.84%
1 ene 1999 año
0.682
-0.008
-1.17%
1 ene 2000 año
0.635
-0.048
-7.0%
1 ene 2001 año
0.517
-0.118
-18.52%
1 ene 2002 año
0.486
-0.031
-6.09%
1 ene 2003 año
0.659
+0.174
35.77%
1 ene 2004 año
0.632
-0.028
-4.17%
1 ene 2005 año
0.569
-0.063
-9.94%
1 ene 2006 año
0.545
-0.024
-4.18%
1 ene 2007 año
0.583
+0.038
6.98%
1 ene 2008 año
1.028
+0.445
76.29%
1 ene 2009 año
0.988
-0.04
-3.93%
1 ene 2010 año
1.186
+0.199
20.1%
1 ene 2011 año
1.383
+0.197
16.59%
1 ene 2012 año
2.092
+0.708
51.21%
1 ene 2013 año
1.776
-0.316
-15.1%
1 ene 2014 año
2.052
+0.276
15.55%
Ranking de los países por los datos estadísticos actuales


Comentarios: