29
/es/
es
AIzaSyAYiBZKx7MnpbEhh9jyipgxe19OcubqV5w
April 1, 2024
131785
Fiji
FJI
true
2
1
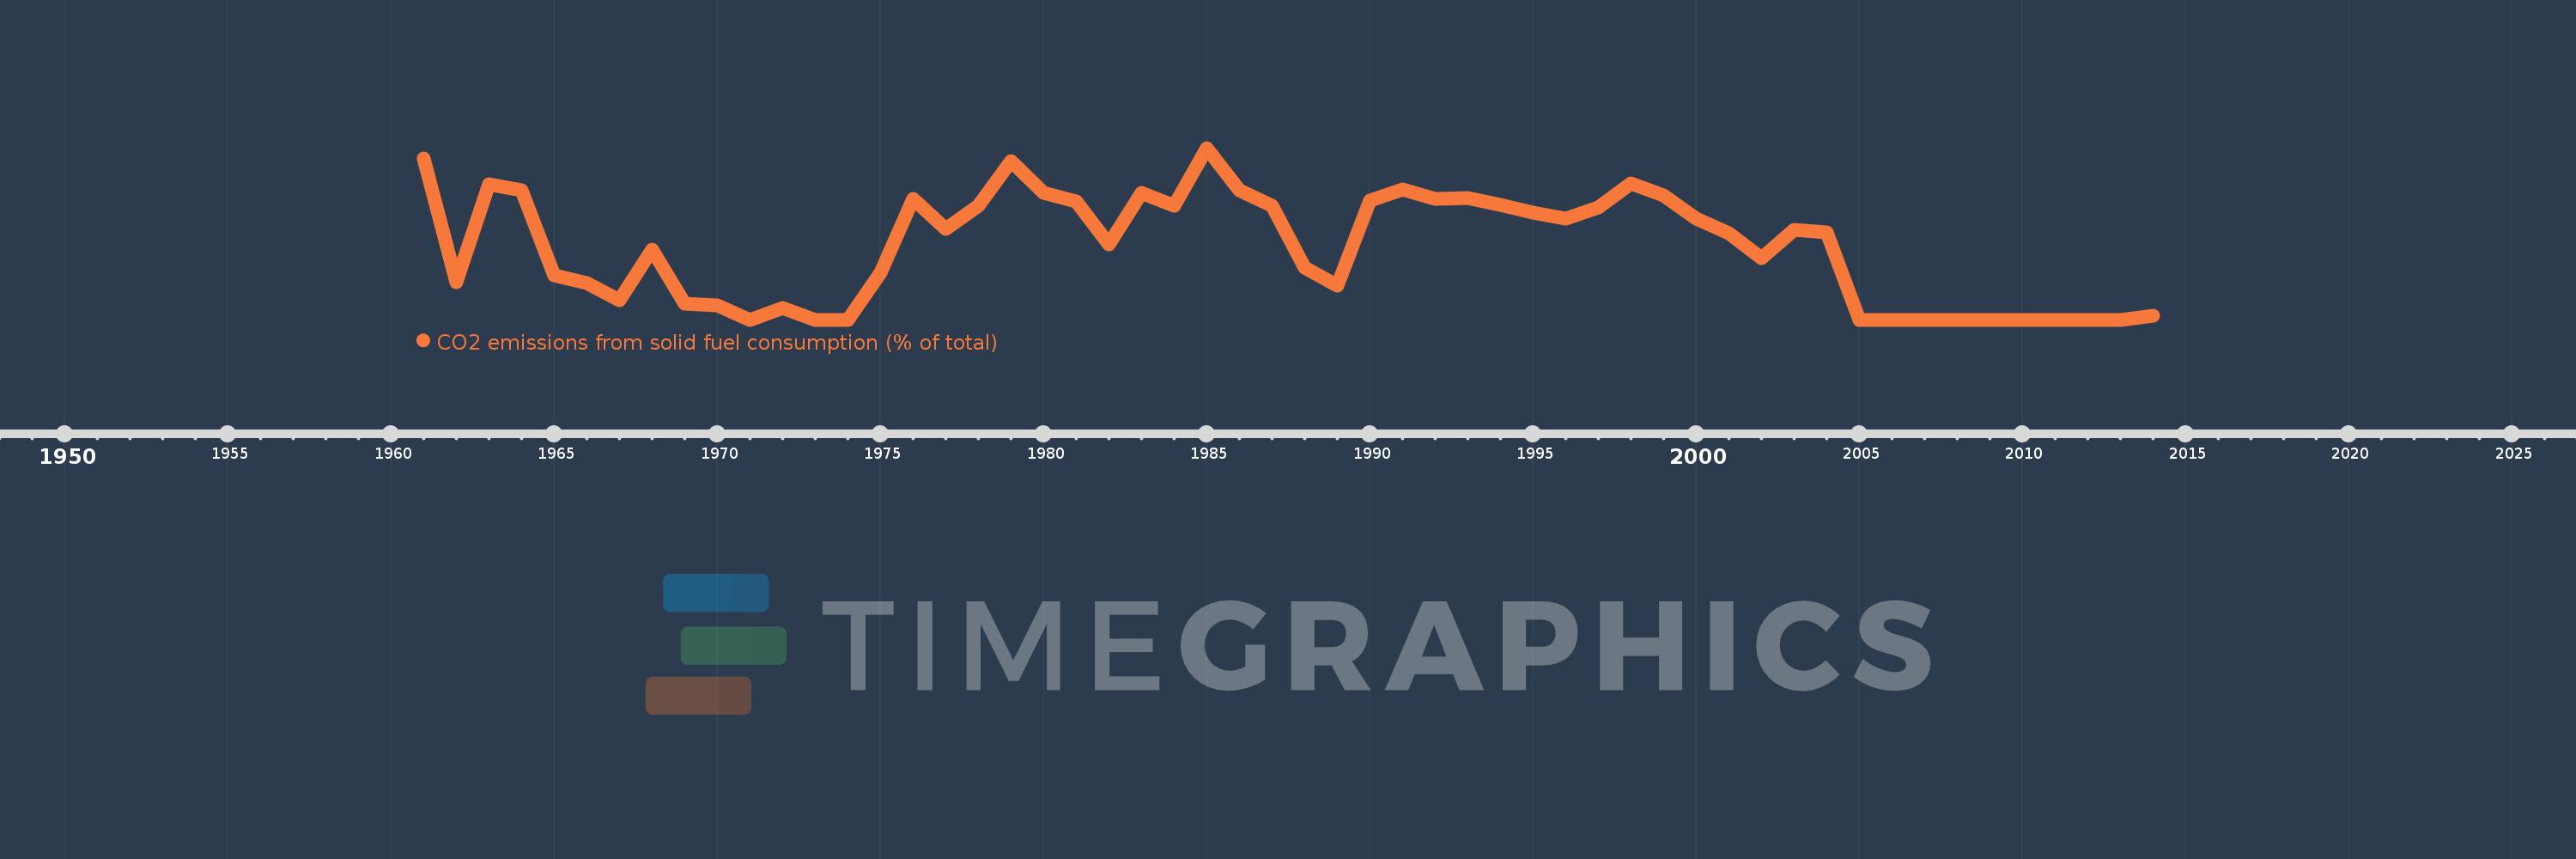
CO2 emissions from solid fuel consumption (% of total)
2014,2013,2012,2011,2010,2009,2008,2007,2006,2005,2004,2003,2002,2001,2000,1999,1998,1997,1996,1995,1994,1993,1992,1991,1990,1989,1988,1987,1986,1985,1984,1983,1982,1981,1980,1979,1978,1977,1976,1975,1974,1973,1972,1971,1970,1969,1968,1967,1966,1965,1964,1963,1962,1961
Estas estadísticas en otros países:
AfghanistanAlbaniaAlgeriaAndorraAngolaAntigua and BarbudaArab WorldArgentinaArmeniaArubaAustraliaAustriaAzerbaijanBahamas, TheBahrainBangladeshBarbadosBelarusBelgiumBelizeBeninBermudaBhutanBoliviaBosnia and HerzegovinaBotswanaBrazilBritish Virgin IslandsBrunei DarussalamBulgariaBurkina FasoBurundiCabo VerdeCambodiaCameroonCanadaCaribbean small statesCayman IslandsCentral African RepublicCentral Europe and the BalticsChadChileChinaColombiaComorosCongo, Dem. Rep.Congo, Rep.Costa RicaCote d'IvoireCroatiaCubaCuracaoCyprusCzech RepublicDenmarkDjiboutiDominicaDominican RepublicEarly-demographic dividendEast Asia & PacificEast Asia & Pacific (excluding high income)East Asia & Pacific (IDA & IBRD countries)EcuadorEgypt, Arab Rep.El SalvadorEquatorial GuineaEritreaEstoniaEthiopiaEuro areaEurope & Central AsiaEurope & Central Asia (excluding high income)Europe & Central Asia (IDA & IBRD countries)European UnionFaroe IslandsFijiFinlandFragile and conflict affected situationsFranceFrench PolynesiaGabonGambia, TheGeorgiaGermanyGhanaGibraltarGreeceGreenlandGrenadaGuatemalaGuineaGuinea-BissauGuyanaHaitiHeavily indebted poor countries (HIPC)High incomeHondurasHong Kong SAR, ChinaHungaryIBRD onlyIcelandIDA & IBRD totalIDA blendIDA onlyIDA totalIndiaIndonesiaIran, Islamic Rep.IraqIrelandIsraelItalyJamaicaJapanJordanKazakhstanKenyaKiribatiKorea, Dem. People’s Rep.Korea, Rep.KuwaitKyrgyz RepublicLao PDRLate-demographic dividendLatin America & Caribbean Latin America & Caribbean (excluding high income)Latin America & the Caribbean (IDA & IBRD countries)LatviaLeast developed countries: UN classificationLebanonLesothoLiberiaLibyaLiechtensteinLithuaniaLow & middle incomeLow incomeLower middle incomeLuxembourgMacao SAR, ChinaMacedonia, FYRMadagascarMalawiMalaysiaMaldivesMaliMaltaMarshall IslandsMauritaniaMauritiusMexicoMicronesia, Fed. Sts.Middle East & North AfricaMiddle East & North Africa (excluding high income)Middle East & North Africa (IDA & IBRD countries)Middle incomeMoldovaMongoliaMontenegroMoroccoMozambiqueMyanmarNamibiaNauruNepalNetherlandsNew CaledoniaNew ZealandNicaraguaNigerNigeriaNorth AmericaNorwayOECD membersOmanOther small statesPacific island small statesPakistanPalauPanamaPapua New GuineaParaguayPeruPhilippinesPolandPortugalPost-demographic dividendPre-demographic dividendQatarRomaniaRussian FederationRwandaSamoaSao Tome and PrincipeSaudi ArabiaSenegalSerbiaSeychellesSierra LeoneSingaporeSint Maarten (Dutch part)Slovak RepublicSloveniaSmall statesSolomon IslandsSomaliaSouth AfricaSouth AsiaSouth Asia (IDA & IBRD)South SudanSpainSri LankaSt. Kitts and NevisSt. LuciaSt. Vincent and the GrenadinesSub-Saharan Africa Sub-Saharan Africa (excluding high income)Sub-Saharan Africa (IDA & IBRD countries)SudanSurinameSwazilandSwedenSwitzerlandSyrian Arab RepublicTajikistanTanzaniaThailandTimor-LesteTogoTongaTrinidad and TobagoTunisiaTurkeyTurkmenistanTurks and Caicos IslandsUgandaUkraineUnited Arab EmiratesUnited KingdomUnited StatesUpper middle incomeUruguayUzbekistanVanuatuVenezuela, RBVietnamWest Bank and GazaWorldYemen, Rep.ZambiaZimbabwe línea de tiempo (timeline):
En esta escala de tiempo se presenta un gráfico de 1961 y 2014 de Fiji. Los datos de 1960 están ausentes. El número de observaciones reales por fecha: 54.
Fuente (nombre):
Indicadores del desarrollo mundial
Fuente (organización):
Carbon Dioxide Information Analysis Center, Environmental Sciences Division, Oak Ridge National Laboratory, Tennessee, United States.
Categorías:
Climate Change, Environment
Se ha actualizado:
23 abr 2017 año
Los indicadores de los cambios de valor en los últimos años
Máximo:
10.063
1 ene 1985 año
A la fecha de observación
Valor
Cambio absoluto
El cambio con respecto al valor anterior
1 ene 1961 año
9.434
+9.434
0.0%
1 ene 1962 año
2.174
-7.26
-76.96%
1 ene 1963 año
7.937
+5.763
265.08%
1 ene 1964 año
7.576
-0.361
-4.55%
1 ene 1965 año
2.586
-4.99
-65.86%
1 ene 1966 año
2.128
-0.459
-17.73%
1 ene 1967 año
1.136
-0.991
-46.59%
1 ene 1968 año
4.124
+2.987
262.89%
1 ene 1969 año
0.926
-3.198
-77.55%
1 ene 1970 año
0.847
-0.078
-8.47%
1 ene 1971 año
0.0
-0.847
-100.0%
1 ene 1972 año
0.667
+0.667
%
1 ene 1973 año
0.0
-0.667
-100.0%
1 ene 1975 año
2.732
+2.732
%
1 ene 1976 año
7.059
+4.327
158.35%
1 ene 1977 año
5.303
-1.756
-24.87%
1 ene 1978 año
6.699
+1.396
26.32%
1 ene 1979 año
9.278
+2.58
38.51%
1 ene 1980 año
7.424
-1.855
-19.99%
1 ene 1981 año
6.912
-0.511
-6.89%
1 ene 1982 año
4.407
-2.506
-36.25%
1 ene 1983 año
7.424
+3.017
68.46%
1 ene 1984 año
6.667
-0.757
-10.2%
1 ene 1985 año
10.063
+3.396
50.94%
1 ene 1986 año
7.595
-2.468
-24.53%
1 ene 1987 año
6.667
-0.928
-12.22%
1 ene 1988 año
3.077
-3.59
-53.85%
1 ene 1989 año
1.987
-1.09
-35.43%
1 ene 1990 año
6.977
+4.99
251.16%
1 ene 1991 año
7.623
+0.647
9.27%
1 ene 1992 año
7.065
-0.558
-7.32%
1 ene 1993 año
7.107
+0.041
0.59%
1 ene 1994 año
6.731
-0.376
-5.29%
1 ene 1995 año
6.278
-0.453
-6.73%
1 ene 1996 año
5.907
-0.371
-5.91%
1 ene 1997 año
6.557
+0.65
11.01%
1 ene 1998 año
7.96
+1.403
21.39%
1 ene 1999 año
7.292
-0.669
-8.4%
1 ene 2000 año
5.936
-1.356
-18.59%
1 ene 2001 año
5.085
-0.851
-14.34%
1 ene 2002 año
3.618
-1.466
-28.84%
1 ene 2003 año
5.263
+1.645
45.45%
1 ene 2004 año
5.106
-0.157
-2.98%
1 ene 2005 año
0.0
-5.106
-100.0%
1 ene 2014 año
0.215
+0.215
%
Ranking de los países por los datos estadísticos actuales


Comentarios: