29
/es/
es
AIzaSyAYiBZKx7MnpbEhh9jyipgxe19OcubqV5w
April 1, 2024
285642
Zambia
ZMB
true
2
1
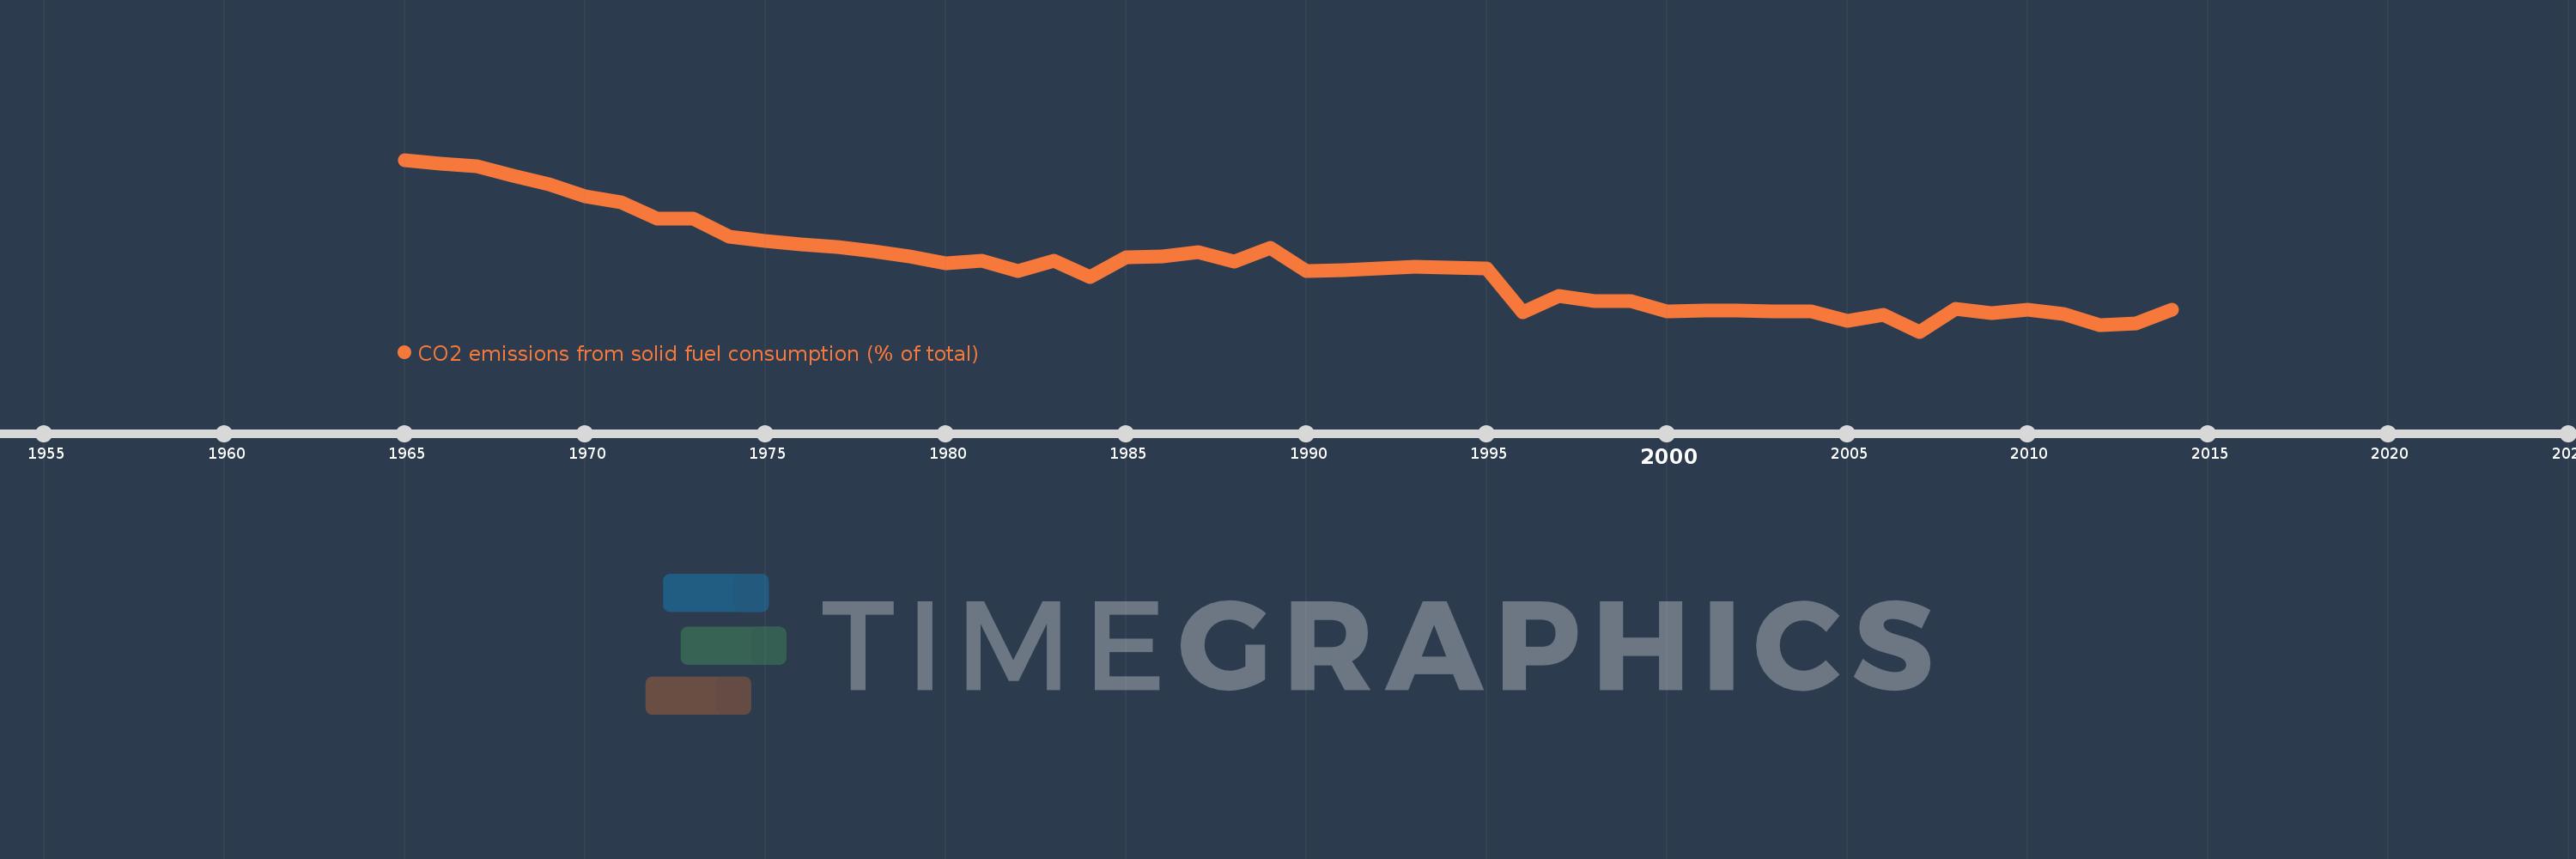
CO2 emissions from solid fuel consumption (% of total)
2014,2013,2012,2011,2010,2009,2008,2007,2006,2005,2004,2003,2002,2001,2000,1999,1998,1997,1996,1995,1994,1993,1992,1991,1990,1989,1988,1987,1986,1985,1984,1983,1982,1981,1980,1979,1978,1977,1976,1975,1974,1973,1972,1971,1970,1969,1968,1967,1966,1965
Estas estadísticas en otros países:
AfghanistanAlbaniaAlgeriaAndorraAngolaAntigua and BarbudaArab WorldArgentinaArmeniaArubaAustraliaAustriaAzerbaijanBahamas, TheBahrainBangladeshBarbadosBelarusBelgiumBelizeBeninBermudaBhutanBoliviaBosnia and HerzegovinaBotswanaBrazilBritish Virgin IslandsBrunei DarussalamBulgariaBurkina FasoBurundiCabo VerdeCambodiaCameroonCanadaCaribbean small statesCayman IslandsCentral African RepublicCentral Europe and the BalticsChadChileChinaColombiaComorosCongo, Dem. Rep.Congo, Rep.Costa RicaCote d'IvoireCroatiaCubaCuracaoCyprusCzech RepublicDenmarkDjiboutiDominicaDominican RepublicEarly-demographic dividendEast Asia & PacificEast Asia & Pacific (excluding high income)East Asia & Pacific (IDA & IBRD countries)EcuadorEgypt, Arab Rep.El SalvadorEquatorial GuineaEritreaEstoniaEthiopiaEuro areaEurope & Central AsiaEurope & Central Asia (excluding high income)Europe & Central Asia (IDA & IBRD countries)European UnionFaroe IslandsFijiFinlandFragile and conflict affected situationsFranceFrench PolynesiaGabonGambia, TheGeorgiaGermanyGhanaGibraltarGreeceGreenlandGrenadaGuatemalaGuineaGuinea-BissauGuyanaHaitiHeavily indebted poor countries (HIPC)High incomeHondurasHong Kong SAR, ChinaHungaryIBRD onlyIcelandIDA & IBRD totalIDA blendIDA onlyIDA totalIndiaIndonesiaIran, Islamic Rep.IraqIrelandIsraelItalyJamaicaJapanJordanKazakhstanKenyaKiribatiKorea, Dem. People’s Rep.Korea, Rep.KuwaitKyrgyz RepublicLao PDRLate-demographic dividendLatin America & Caribbean Latin America & Caribbean (excluding high income)Latin America & the Caribbean (IDA & IBRD countries)LatviaLeast developed countries: UN classificationLebanonLesothoLiberiaLibyaLiechtensteinLithuaniaLow & middle incomeLow incomeLower middle incomeLuxembourgMacao SAR, ChinaMacedonia, FYRMadagascarMalawiMalaysiaMaldivesMaliMaltaMarshall IslandsMauritaniaMauritiusMexicoMicronesia, Fed. Sts.Middle East & North AfricaMiddle East & North Africa (excluding high income)Middle East & North Africa (IDA & IBRD countries)Middle incomeMoldovaMongoliaMontenegroMoroccoMozambiqueMyanmarNamibiaNauruNepalNetherlandsNew CaledoniaNew ZealandNicaraguaNigerNigeriaNorth AmericaNorwayOECD membersOmanOther small statesPacific island small statesPakistanPalauPanamaPapua New GuineaParaguayPeruPhilippinesPolandPortugalPost-demographic dividendPre-demographic dividendQatarRomaniaRussian FederationRwandaSamoaSao Tome and PrincipeSaudi ArabiaSenegalSerbiaSeychellesSierra LeoneSingaporeSint Maarten (Dutch part)Slovak RepublicSloveniaSmall statesSolomon IslandsSomaliaSouth AfricaSouth AsiaSouth Asia (IDA & IBRD)South SudanSpainSri LankaSt. Kitts and NevisSt. LuciaSt. Vincent and the GrenadinesSub-Saharan Africa Sub-Saharan Africa (excluding high income)Sub-Saharan Africa (IDA & IBRD countries)SudanSurinameSwazilandSwedenSwitzerlandSyrian Arab RepublicTajikistanTanzaniaThailandTimor-LesteTogoTongaTrinidad and TobagoTunisiaTurkeyTurkmenistanTurks and Caicos IslandsUgandaUkraineUnited Arab EmiratesUnited KingdomUnited StatesUpper middle incomeUruguayUzbekistanVanuatuVenezuela, RBVietnamWest Bank and GazaWorldYemen, Rep.ZambiaZimbabwe línea de tiempo (timeline):
En esta escala de tiempo se presenta un gráfico de 1965 y 2014 de Zambia. Los datos de 1964 están ausentes. El número de observaciones reales por fecha: 50.
Fuente (nombre):
Indicadores del desarrollo mundial
Fuente (organización):
Carbon Dioxide Information Analysis Center, Environmental Sciences Division, Oak Ridge National Laboratory, Tennessee, United States.
Categorías:
Climate Change, Environment
Se ha actualizado:
23 abr 2017 año
Los indicadores de los cambios de valor en los últimos años
Mínimo:
6.294
1 ene 2007 año
Máximo:
84.004
1 ene 1965 año
A la fecha de observación
Valor
Cambio absoluto
El cambio con respecto al valor anterior
1 ene 1965 año
84.004
+84.004
0.0%
1 ene 1966 año
82.303
-1.701
-2.03%
1 ene 1967 año
81.047
-1.256
-1.53%
1 ene 1968 año
76.817
-4.23
-5.22%
1 ene 1969 año
72.815
-4.002
-5.21%
1 ene 1970 año
67.581
-5.233
-7.19%
1 ene 1971 año
64.689
-2.893
-4.28%
1 ene 1972 año
57.35
-7.339
-11.34%
1 ene 1973 año
57.529
+0.179
0.31%
1 ene 1974 año
49.042
-8.488
-14.75%
1 ene 1975 año
47.295
-1.747
-3.56%
1 ene 1976 año
45.553
-1.742
-3.68%
1 ene 1977 año
44.627
-0.926
-2.03%
1 ene 1978 año
42.507
-2.119
-4.75%
1 ene 1979 año
40.401
-2.107
-4.96%
1 ene 1980 año
37.233
-3.168
-7.84%
1 ene 1981 año
38.318
+1.085
2.91%
1 ene 1982 año
33.66
-4.658
-12.16%
1 ene 1983 año
38.438
+4.777
14.19%
1 ene 1984 año
30.942
-7.496
-19.5%
1 ene 1985 año
40.052
+9.11
29.44%
1 ene 1986 año
40.213
+0.161
0.4%
1 ene 1987 año
42.386
+2.173
5.4%
1 ene 1988 año
37.992
-4.394
-10.37%
1 ene 1989 año
43.991
+5.999
15.79%
1 ene 1990 año
33.662
-10.329
-23.48%
1 ene 1991 año
34.033
+0.371
1.1%
1 ene 1992 año
34.75
+0.717
2.11%
1 ene 1993 año
35.522
+0.773
2.22%
1 ene 1994 año
35.337
-0.185
-0.52%
1 ene 1995 año
34.697
-0.64
-1.81%
1 ene 1996 año
15.203
-19.494
-56.18%
1 ene 1997 año
22.549
+7.346
48.32%
1 ene 1998 año
20.245
-2.304
-10.22%
1 ene 1999 año
19.968
-0.277
-1.37%
1 ene 2000 año
15.416
-4.552
-22.8%
1 ene 2001 año
15.895
+0.48
3.11%
1 ene 2002 año
15.769
-0.126
-0.79%
1 ene 2003 año
15.342
-0.427
-2.71%
1 ene 2004 año
15.278
-0.064
-0.42%
1 ene 2005 año
11.111
-4.167
-27.27%
1 ene 2006 año
13.782
+2.671
24.04%
1 ene 2007 año
6.294
-7.488
-54.33%
1 ene 2008 año
16.495
+10.201
162.08%
1 ene 2009 año
14.454
-2.041
-12.37%
1 ene 2010 año
16.11
+1.657
11.46%
1 ene 2011 año
14.073
-2.037
-12.65%
1 ene 2012 año
9.125
-4.948
-35.16%
1 ene 2013 año
10.011
+0.886
9.7%
1 ene 2014 año
16.395
+6.384
63.78%
Ranking de los países por los datos estadísticos actuales


Comentarios: