29
/es/
es
AIzaSyAYiBZKx7MnpbEhh9jyipgxe19OcubqV5w
April 1, 2024
286947
Zimbabwe
ZWE
true
2
1
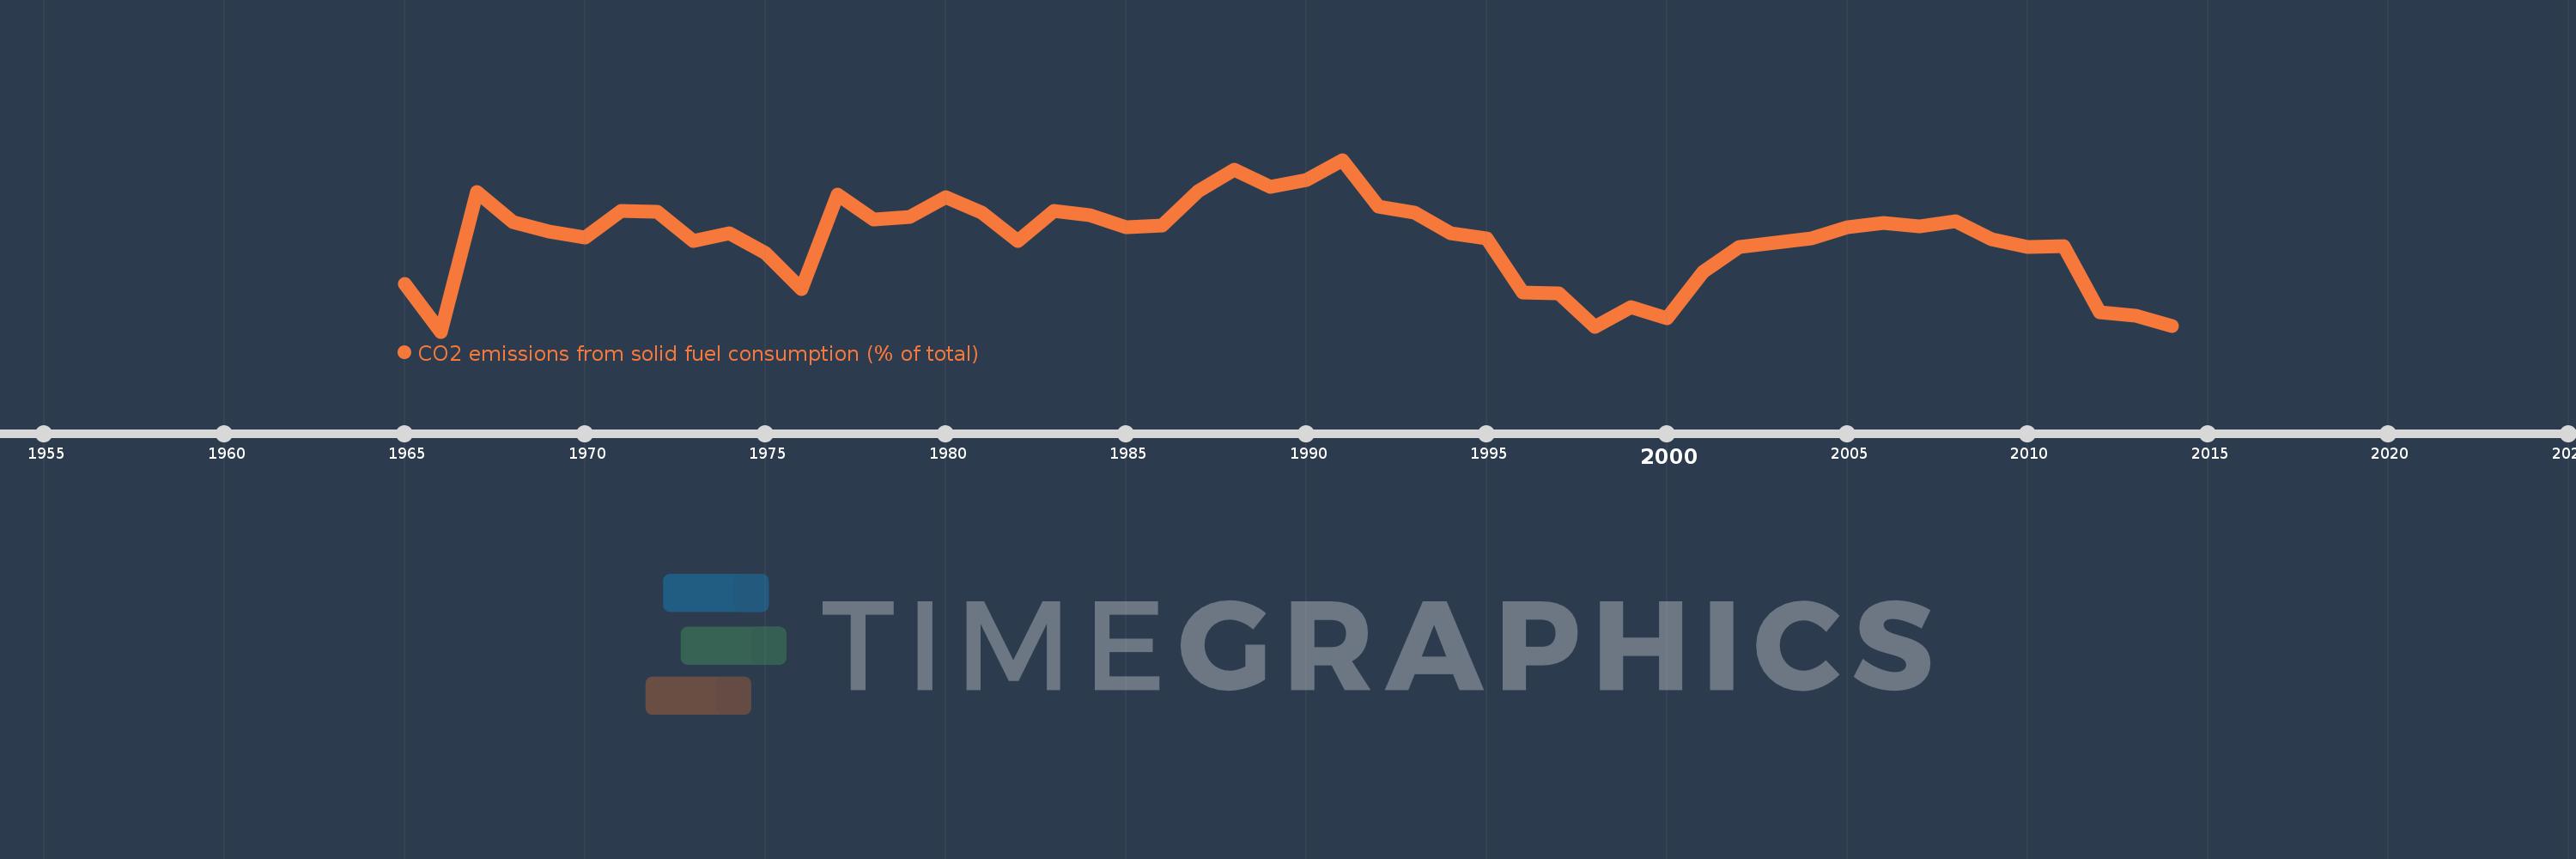
CO2 emissions from solid fuel consumption (% of total)
2014,2013,2012,2011,2010,2009,2008,2007,2006,2005,2004,2003,2002,2001,2000,1999,1998,1997,1996,1995,1994,1993,1992,1991,1990,1989,1988,1987,1986,1985,1984,1983,1982,1981,1980,1979,1978,1977,1976,1975,1974,1973,1972,1971,1970,1969,1968,1967,1966,1965
Estas estadísticas en otros países:
AfghanistanAlbaniaAlgeriaAndorraAngolaAntigua and BarbudaArab WorldArgentinaArmeniaArubaAustraliaAustriaAzerbaijanBahamas, TheBahrainBangladeshBarbadosBelarusBelgiumBelizeBeninBermudaBhutanBoliviaBosnia and HerzegovinaBotswanaBrazilBritish Virgin IslandsBrunei DarussalamBulgariaBurkina FasoBurundiCabo VerdeCambodiaCameroonCanadaCaribbean small statesCayman IslandsCentral African RepublicCentral Europe and the BalticsChadChileChinaColombiaComorosCongo, Dem. Rep.Congo, Rep.Costa RicaCote d'IvoireCroatiaCubaCuracaoCyprusCzech RepublicDenmarkDjiboutiDominicaDominican RepublicEarly-demographic dividendEast Asia & PacificEast Asia & Pacific (excluding high income)East Asia & Pacific (IDA & IBRD countries)EcuadorEgypt, Arab Rep.El SalvadorEquatorial GuineaEritreaEstoniaEthiopiaEuro areaEurope & Central AsiaEurope & Central Asia (excluding high income)Europe & Central Asia (IDA & IBRD countries)European UnionFaroe IslandsFijiFinlandFragile and conflict affected situationsFranceFrench PolynesiaGabonGambia, TheGeorgiaGermanyGhanaGibraltarGreeceGreenlandGrenadaGuatemalaGuineaGuinea-BissauGuyanaHaitiHeavily indebted poor countries (HIPC)High incomeHondurasHong Kong SAR, ChinaHungaryIBRD onlyIcelandIDA & IBRD totalIDA blendIDA onlyIDA totalIndiaIndonesiaIran, Islamic Rep.IraqIrelandIsraelItalyJamaicaJapanJordanKazakhstanKenyaKiribatiKorea, Dem. People’s Rep.Korea, Rep.KuwaitKyrgyz RepublicLao PDRLate-demographic dividendLatin America & Caribbean Latin America & Caribbean (excluding high income)Latin America & the Caribbean (IDA & IBRD countries)LatviaLeast developed countries: UN classificationLebanonLesothoLiberiaLibyaLiechtensteinLithuaniaLow & middle incomeLow incomeLower middle incomeLuxembourgMacao SAR, ChinaMacedonia, FYRMadagascarMalawiMalaysiaMaldivesMaliMaltaMarshall IslandsMauritaniaMauritiusMexicoMicronesia, Fed. Sts.Middle East & North AfricaMiddle East & North Africa (excluding high income)Middle East & North Africa (IDA & IBRD countries)Middle incomeMoldovaMongoliaMontenegroMoroccoMozambiqueMyanmarNamibiaNauruNepalNetherlandsNew CaledoniaNew ZealandNicaraguaNigerNigeriaNorth AmericaNorwayOECD membersOmanOther small statesPacific island small statesPakistanPalauPanamaPapua New GuineaParaguayPeruPhilippinesPolandPortugalPost-demographic dividendPre-demographic dividendQatarRomaniaRussian FederationRwandaSamoaSao Tome and PrincipeSaudi ArabiaSenegalSerbiaSeychellesSierra LeoneSingaporeSint Maarten (Dutch part)Slovak RepublicSloveniaSmall statesSolomon IslandsSomaliaSouth AfricaSouth AsiaSouth Asia (IDA & IBRD)South SudanSpainSri LankaSt. Kitts and NevisSt. LuciaSt. Vincent and the GrenadinesSub-Saharan Africa Sub-Saharan Africa (excluding high income)Sub-Saharan Africa (IDA & IBRD countries)SudanSurinameSwazilandSwedenSwitzerlandSyrian Arab RepublicTajikistanTanzaniaThailandTimor-LesteTogoTongaTrinidad and TobagoTunisiaTurkeyTurkmenistanTurks and Caicos IslandsUgandaUkraineUnited Arab EmiratesUnited KingdomUnited StatesUpper middle incomeUruguayUzbekistanVanuatuVenezuela, RBVietnamWest Bank and GazaWorldYemen, Rep.ZambiaZimbabwe línea de tiempo (timeline):
En esta escala de tiempo se presenta un gráfico de 1965 y 2014 de Zimbabwe. Los datos de 1964 están ausentes. El número de observaciones reales por fecha: 50.
Fuente (nombre):
Indicadores del desarrollo mundial
Fuente (organización):
Carbon Dioxide Information Analysis Center, Environmental Sciences Division, Oak Ridge National Laboratory, Tennessee, United States.
Categorías:
Climate Change, Environment
Se ha actualizado:
23 abr 2017 año
Los indicadores de los cambios de valor en los últimos años
Mínimo:
65.331
1 ene 1966 año
Máximo:
86.613
1 ene 1991 año
A la fecha de observación
Valor
Cambio absoluto
El cambio con respecto al valor anterior
1 ene 1965 año
71.23
+71.23
0.0%
1 ene 1966 año
65.331
-5.899
-8.28%
1 ene 1967 año
82.596
+17.265
26.43%
1 ene 1968 año
78.893
-3.703
-4.48%
1 ene 1969 año
77.714
-1.179
-1.49%
1 ene 1970 año
76.969
-0.745
-0.96%
1 ene 1971 año
80.323
+3.354
4.36%
1 ene 1972 año
80.201
-0.122
-0.15%
1 ene 1973 año
76.594
-3.607
-4.5%
1 ene 1974 año
77.479
+0.885
1.16%
1 ene 1975 año
75.101
-2.378
-3.07%
1 ene 1976 año
70.604
-4.497
-5.99%
1 ene 1977 año
82.321
+11.717
16.6%
1 ene 1978 año
79.18
-3.141
-3.82%
1 ene 1979 año
79.487
+0.307
0.39%
1 ene 1980 año
81.956
+2.469
3.11%
1 ene 1981 año
80.099
-1.857
-2.27%
1 ene 1982 año
76.525
-3.573
-4.46%
1 ene 1983 año
80.275
+3.749
4.9%
1 ene 1984 año
79.741
-0.534
-0.67%
1 ene 1985 año
78.307
-1.433
-1.8%
1 ene 1986 año
78.492
+0.185
0.24%
1 ene 1987 año
82.709
+4.217
5.37%
1 ene 1988 año
85.371
+2.661
3.22%
1 ene 1989 año
83.307
-2.064
-2.42%
1 ene 1990 año
84.164
+0.857
1.03%
1 ene 1991 año
86.613
+2.449
2.91%
1 ene 1992 año
80.788
-5.825
-6.73%
1 ene 1993 año
80.017
-0.771
-0.95%
1 ene 1994 año
77.534
-2.483
-3.1%
1 ene 1995 año
76.87
-0.664
-0.86%
1 ene 1996 año
70.189
-6.681
-8.69%
1 ene 1997 año
70.066
-0.123
-0.18%
1 ene 1998 año
65.946
-4.12
-5.88%
1 ene 1999 año
68.33
+2.385
3.62%
1 ene 2000 año
66.999
-1.332
-1.95%
1 ene 2001 año
72.768
+5.769
8.61%
1 ene 2002 año
75.808
+3.04
4.18%
1 ene 2003 año
76.31
+0.502
0.66%
1 ene 2004 año
76.875
+0.565
0.74%
1 ene 2005 año
78.276
+1.401
1.82%
1 ene 2006 año
78.754
+0.478
0.61%
1 ene 2007 año
78.413
-0.34
-0.43%
1 ene 2008 año
79.043
+0.63
0.8%
1 ene 2009 año
76.734
-2.309
-2.92%
1 ene 2010 año
75.803
-0.931
-1.21%
1 ene 2011 año
75.94
+0.137
0.18%
1 ene 2012 año
67.739
-8.201
-10.8%
1 ene 2013 año
67.338
-0.401
-0.59%
1 ene 2014 año
66.019
-1.319
-1.96%
Ranking de los países por los datos estadísticos actuales


Comentarios: