29
/es/
es
AIzaSyAYiBZKx7MnpbEhh9jyipgxe19OcubqV5w
April 1, 2024
55577
Pre-demographic dividend
PRE
false
2
1
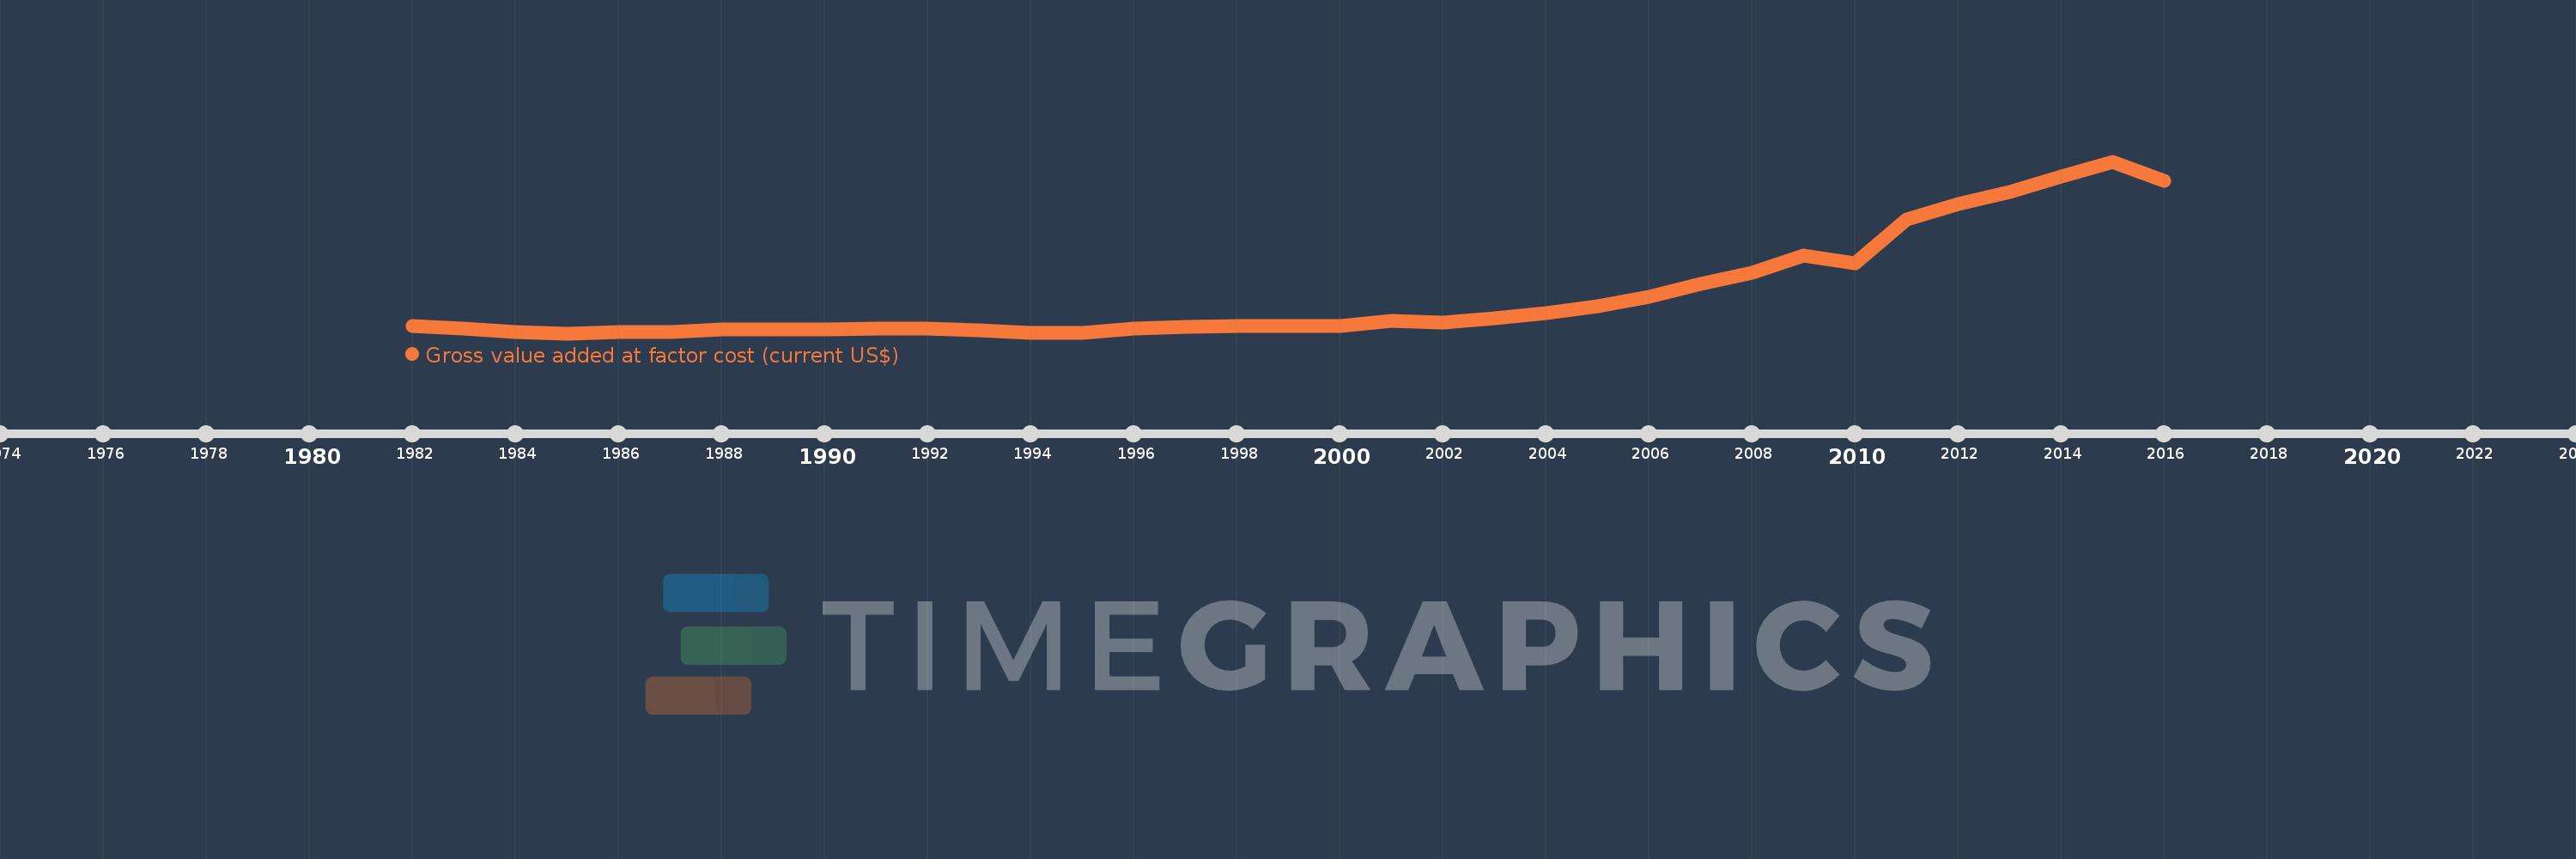
Gross value added at factor cost (current US$)
2016,2015,2014,2013,2012,2011,2010,2009,2008,2007,2006,2005,2004,2003,2002,2001,2000,1999,1998,1997,1996,1995,1994,1993,1992,1991,1990,1989,1988,1987,1986,1985,1984,1983,1982
Estas estadísticas en otros países:
AfghanistanAlbaniaAlgeriaAndorraAntigua and BarbudaArgentinaArmeniaArubaAustraliaAustriaAzerbaijanBahamas, TheBahrainBangladeshBarbadosBelarusBelgiumBelizeBeninBermudaBhutanBoliviaBosnia and HerzegovinaBotswanaBrazilBulgariaBurkina FasoBurundiCabo VerdeCambodiaCameroonCanadaCaribbean small statesCayman IslandsCentral African RepublicCentral Europe and the BalticsChadChileColombiaCongo, Dem. Rep.Costa RicaCroatiaCubaCyprusCzech RepublicDenmarkDjiboutiDominicaDominican RepublicEarly-demographic dividendEcuadorEgypt, Arab Rep.El SalvadorEquatorial GuineaEritreaEstoniaEthiopiaEuro areaEurope & Central AsiaEurope & Central Asia (excluding high income)Europe & Central Asia (IDA & IBRD countries)European UnionFaroe IslandsFijiFinlandFranceGabonGambia, TheGeorgiaGermanyGhanaGreeceGrenadaGuatemalaGuineaGuinea-BissauGuyanaHeavily indebted poor countries (HIPC)High incomeHondurasHong Kong SAR, ChinaHungaryIcelandIDA blendIDA onlyIDA totalIndiaIndonesiaIran, Islamic Rep.IrelandItalyJamaicaJapanJordanKazakhstanKenyaKiribatiKorea, Rep.KosovoKuwaitKyrgyz RepublicLao PDRLatin America & Caribbean Latin America & Caribbean (excluding high income)Latin America & the Caribbean (IDA & IBRD countries)LatviaLeast developed countries: UN classificationLebanonLesothoLiberiaLibyaLiechtensteinLithuaniaLow incomeLower middle incomeLuxembourgMacao SAR, ChinaMacedonia, FYRMadagascarMalawiMalaysiaMaldivesMaliMaltaMarshall IslandsMauritaniaMauritiusMexicoMicronesia, Fed. Sts.Middle East & North Africa (excluding high income)Middle East & North Africa (IDA & IBRD countries)MoldovaMongoliaMontenegroMoroccoMozambiqueNamibiaNepalNetherlandsNew ZealandNicaraguaNigeriaNorth AmericaNorwayOECD membersOmanPacific island small statesPakistanPalauPanamaPapua New GuineaParaguayPeruPolandPortugalPost-demographic dividendPre-demographic dividendRomaniaRussian FederationRwandaSao Tome and PrincipeSenegalSerbiaSeychellesSierra LeoneSingaporeSlovak RepublicSloveniaSolomon IslandsSouth AfricaSouth AsiaSouth Asia (IDA & IBRD)SpainSri LankaSt. Kitts and NevisSt. LuciaSt. Vincent and the GrenadinesSub-Saharan Africa Sub-Saharan Africa (excluding high income)Sub-Saharan Africa (IDA & IBRD countries)SudanSurinameSwazilandSwedenSwitzerlandSyrian Arab RepublicTajikistanTanzaniaThailandTimor-LesteTongaTrinidad and TobagoTunisiaTurkeyTurkmenistanTuvaluUgandaUkraineUnited KingdomUnited StatesUruguayUzbekistanVanuatuVenezuela, RBVietnamWest Bank and GazaWorldYemen, Rep.ZambiaZimbabwe línea de tiempo (timeline):
En esta escala de tiempo se presenta un gráfico de 1982 y 2016 de Pre-demographic dividend. Los datos de 1981 están ausentes. El número de observaciones reales por fecha: 35.
Fuente (nombre):
Indicadores del desarrollo mundial
Fuente (organización):
World Bank national accounts data, and OECD National Accounts data files.
Categorías:
Economy & Growth
Se ha actualizado:
23 abr 2017 año
Los indicadores de los cambios de valor en los últimos años
Mínimo:
129.269 bn
1 ene 1985 año
Máximo:
1.486 billones
1 ene 2015 año
A la fecha de observación
Valor
Cambio absoluto
El cambio con respecto al valor anterior
1 ene 1982 año
186.461 bn
+186.461 bn
0.0%
1 ene 1983 año
169.094 bn
-17.367 bn
-9.31%
1 ene 1984 año
136.747 bn
-32.347 bn
-19.13%
1 ene 1985 año
129.269 bn
-7.478 bn
-5.47%
1 ene 1986 año
137.758 bn
+8.489 bn
6.57%
1 ene 1987 año
142.677 bn
+4.919 bn
3.57%
1 ene 1988 año
163.137 bn
+20.46 bn
14.34%
1 ene 1989 año
158.74 bn
-4.397 bn
-2.7%
1 ene 1990 año
157.049 bn
-1.691 bn
-1.07%
1 ene 1991 año
167.455 bn
+10.406 bn
6.63%
1 ene 1992 año
164.653 bn
-2.802 bn
-1.67%
1 ene 1993 año
155.077 bn
-9.576 bn
-5.82%
1 ene 1994 año
135.996 bn
-19.08 bn
-12.3%
1 ene 1995 año
134.584 bn
-1.412 bn
-1.04%
1 ene 1996 año
163.619 bn
+29.035 bn
21.57%
1 ene 1997 año
179.863 bn
+16.244 bn
9.93%
1 ene 1998 año
189.493 bn
+9.63 bn
5.35%
1 ene 1999 año
187.213 bn
-2.28 bn
-1.2%
1 ene 2000 año
189.984 bn
+2.771 bn
1.48%
1 ene 2001 año
227.642 bn
+37.658 bn
19.82%
1 ene 2002 año
211.403 bn
-16.239 bn
-7.13%
1 ene 2003 año
248.84 bn
+37.437 bn
17.71%
1 ene 2004 año
285.476 bn
+36.637 bn
14.72%
1 ene 2005 año
343.68 bn
+58.204 bn
20.39%
1 ene 2006 año
419.707 bn
+76.027 bn
22.12%
1 ene 2007 año
517.297 bn
+97.59 bn
23.25%
1 ene 2008 año
609.506 bn
+92.209 bn
17.83%
1 ene 2009 año
745.146 bn
+135.64 bn
22.25%
1 ene 2010 año
682.664 bn
-62.482 bn
-8.39%
1 ene 2011 año
1.029 billones
+346.772 bn
50.8%
1 ene 2012 año
1.15 billones
+120.293 bn
11.69%
1 ene 2013 año
1.247 billones
+96.929 bn
8.43%
1 ene 2014 año
1.366 billones
+119.266 bn
9.57%
1 ene 2015 año
1.486 billones
+120.416 bn
8.82%
1 ene 2016 año
1.332 billones
-154.094 bn
-10.37%
Ranking de los países por los datos estadísticos actuales


Comentarios: